US Dollar Outlook: USD/CAD
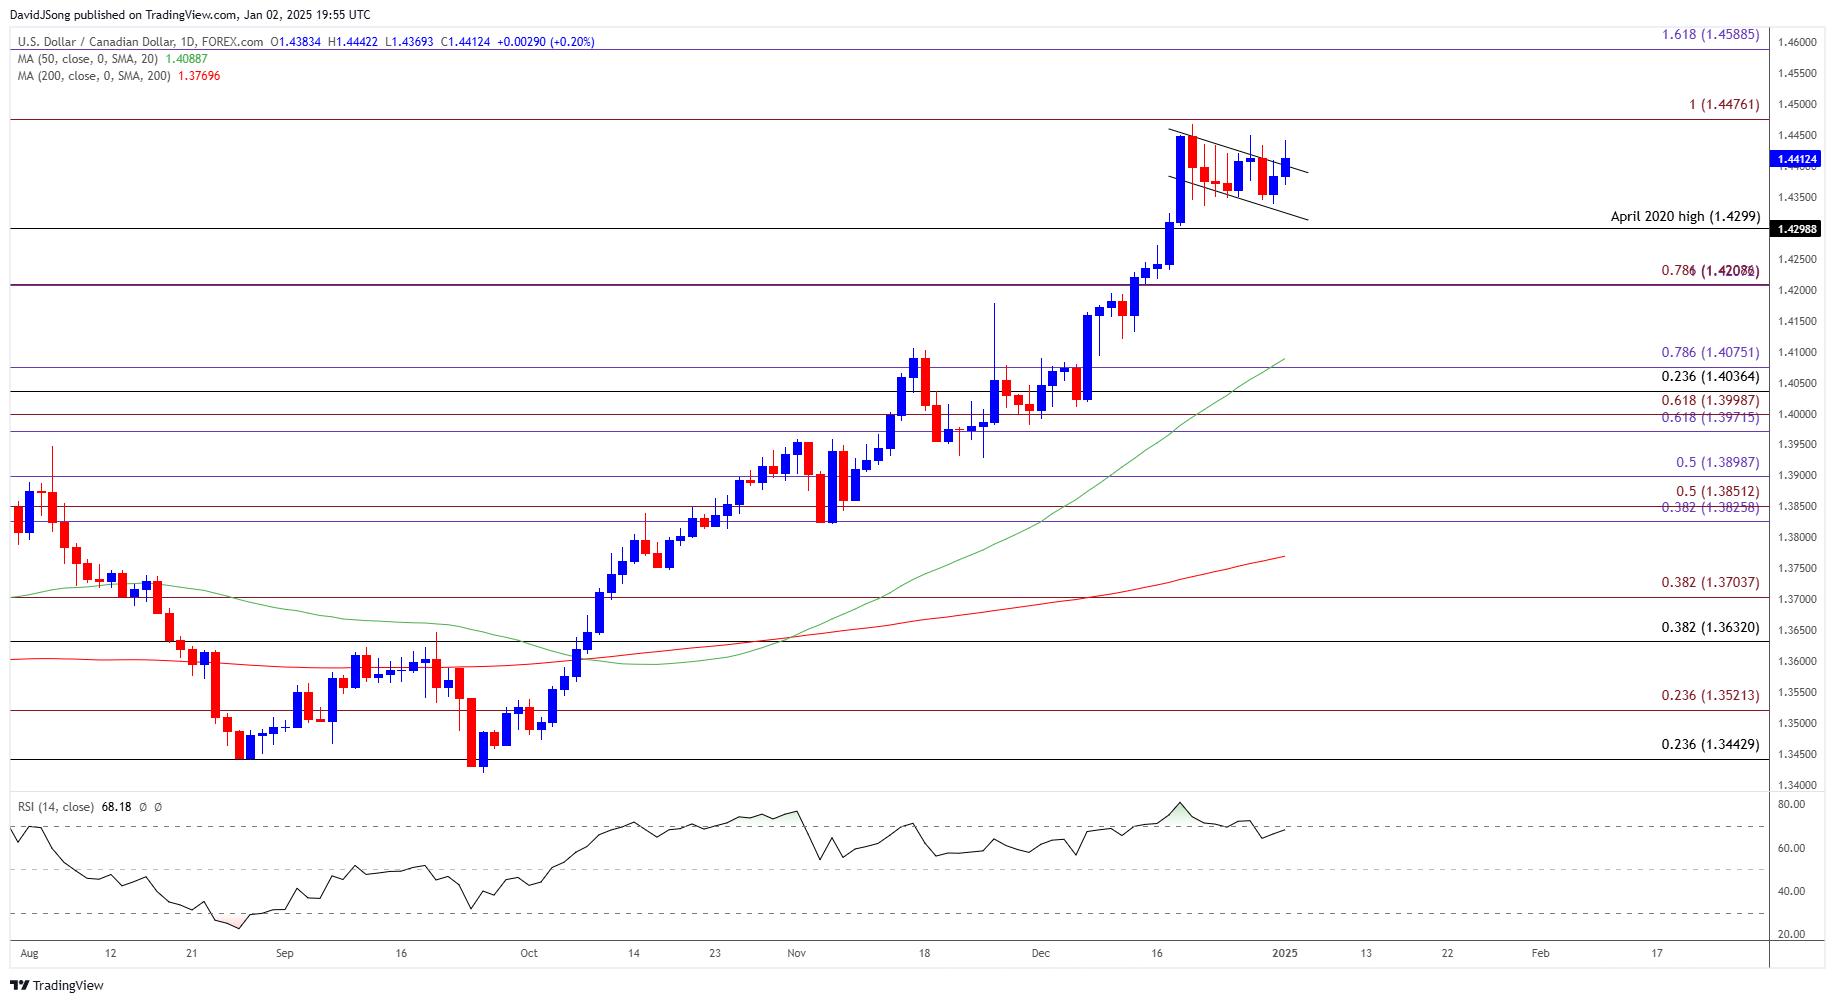
USD/CAD extends the rebound from the weekly low (1.4338) to push the Relative strength Index (RSI) back towards overbought territory, but the oscillator may show the bullish momentum abating should it struggle to push back above 70.
USD/CAD Rebound Pushes RSI Back Towards Overbought Zone
A bull-flag formation seems to have taken shape as USD/CAD trades within the December range, and the exchange rate may attempt to test the 2024 high (1.4467) as it initiates a series of higher highs and lows.
Join David Song for the Weekly Fundamental Market Outlook webinar.
David provides a market overview and takes questions in real-time. Register Here
In turn, USD/CAD may extend the advance from last year should a continuation pattern unfold over the coming days, and the exchange rate may track the positive slope in the 50-Day SMA (1.4089) as it holds above the moving average.
US Economic Calendar

Nevertheless, the update to the US ISM Manufacturing survey may sway USD/CAD as the index is expected to hold steady at 48.4 in December, and another print below 50 may warn of a slowing economy as it indicates a contraction for the sector.
In turn, speculation for lower US interest rates may produce headwinds for the Greenback as the Federal Reserve appears to be on track to further unwind its restrictive policy in 2025, but a higher-than-expected ISM Manufacturing print may keep USD/CAD afloat as it instills an improved outlook for growth.
With that said, USD/CAD may attempt to break out of the December range as it extends the rebound from the weekly low (1.4338), but lack of momentum to test the 2024 high (1.4467) may negate the threat of a bull-flag formation.
USD/CAD Price Chart – Daily

Chart Prepared by David Song, Senior Strategist; USD/CAD Price on TradingView
- USD/CAD seems to be threatening the descending channel carried over from last month as it trades to a fresh weekly high (1.4442), and a bull-flag formation may start to unfold should the exchange rate retrace the decline from the 2024 high (1.4467).
- Need a break/close above 1.4480 (100% Fibonacci extension) to open up 1.4590 (161.8% Fibonacci extension), but USD/CAD may negate the continuation pattern if it struggles to test the 2024 high (1.4467).
- Failure to hold above the April 2020 high (1.4299) may pull USD/CAD back towards 1.4210 (78.6% Fibonacci extension), with the next region of interest coming in around 1.4040 (23.6% Fibonacci retracement) to 1.4080 (78.6% Fibonacci extension).
Additional Market Outlooks
British Pound Forecast: GBP/USD Pushes Below May Low to Eye 2024 Low
AUD/USD Vulnerable to Change in RBA Policy
US Economy Proves Stronger-Than-Expected in 2024
2025 Central Bank Outlook Preview
--- Written by David Song, Senior Strategist
Follow on Twitter at @DavidJSong


