- Calendar is quiet for USD/JPY traders in the week ahead
- Strong correlation with US interest rates has weakened noticeably
- US and Japanese political headlines may generate short-term volatility
- Price signals favoured to deliver directional clues
Overview
The resistance zone overhanging USD/JPY held firm at the first time of testing, seeing it sink back below 150 on Friday. With little event risk in the US or Japan this week, and with its strong correlation with US Treasury yields weakening noticeably, price signals may provide the cleanest read for traders on directional risks in the coming days.
Event risk ebbs temporarily
It’s going to be a quiet week for USD/JPY traders when it comes to known event risk. The US calendar is shown below with nothing bar initial jobless claims on Thursday likely to generate any meaningful volatility. Given weather disruptions in Gulf states may created havoc with the series, it too may pass with little fanfare. While the S&P Global flash PMIs can be market moving in Europe, the US version tends to be overlooked in favour of the ISM PMIs released at the start of every month.

Source: Refinitiv
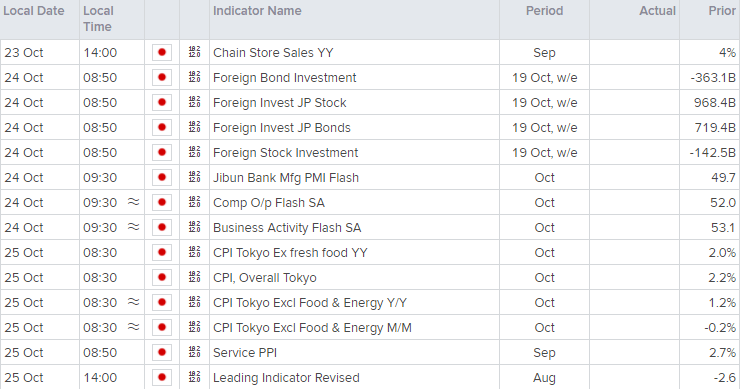
In Japan, the only data point of note is the Tokyo consumer price inflation (CPI) report for October which is released three weeks before the national figure. The Bank of Japan’s preferred underlying measure which strips out fresh food prices is seen slowing to 1.7% from 2.0%, largely due to weaker energy prices.
It’s rare for this release to create volatility in USD/JPY, although it’s noteworthy that we saw a decent upside surprise for the September report when it was released a month ago. Once should be deemed an anomaly, but twice creates a trend.

Source: Refinitiv
Like the data calendar, central bank event risk appears limited with many repeat Fed speakers from last week. Chair Jerome Powell is not in action, so unless we see a concerted effort to push market pricing one way or another, there’s not a lot to interest traders.

Source: TradingView
Markets trim Fed rate cut bets
As a reference point for what markets expect the Fed to do looking forward, the Fed funds futures curve currently prices 145 basis points worth of rate cuts by the end of 2025. That’s slightly less than six 25-point cuts, down from nine in mid-September.

Source: TradingView
Strong correlation with US rates breaks down
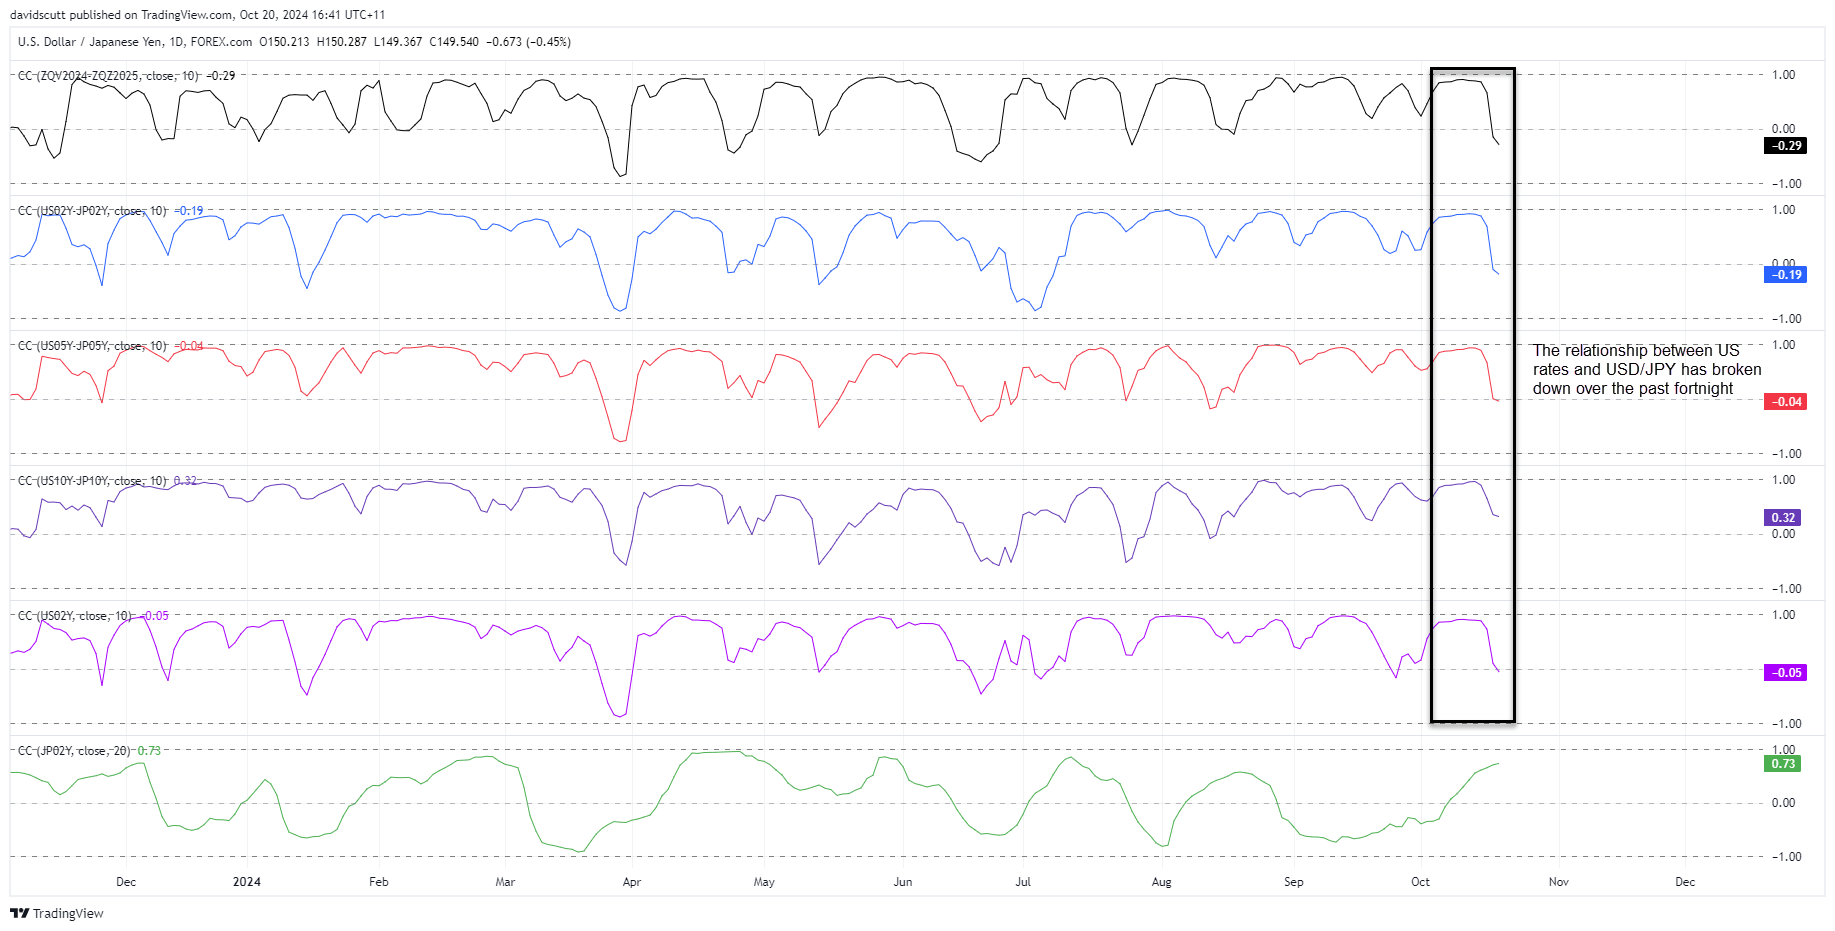
While you should keep an eye on US rate expectations and Treasury yields when trading USD/JPY, it’s noteworthy that over the past fortnight the strong relationship between the two has broken down, suggesting another factor may be temporarily driving direction.

Source: TradingView
It could be political factors – the US election is coming up in two weeks while Japan’s will be held next Sunday (although no one expects the ruling LDP will lose power) – but it’s more likely the breakdown is due to where USD/JPY sits on the charts.
USD/JPY fails on first attempt of major resistance zone

Source: TradingView
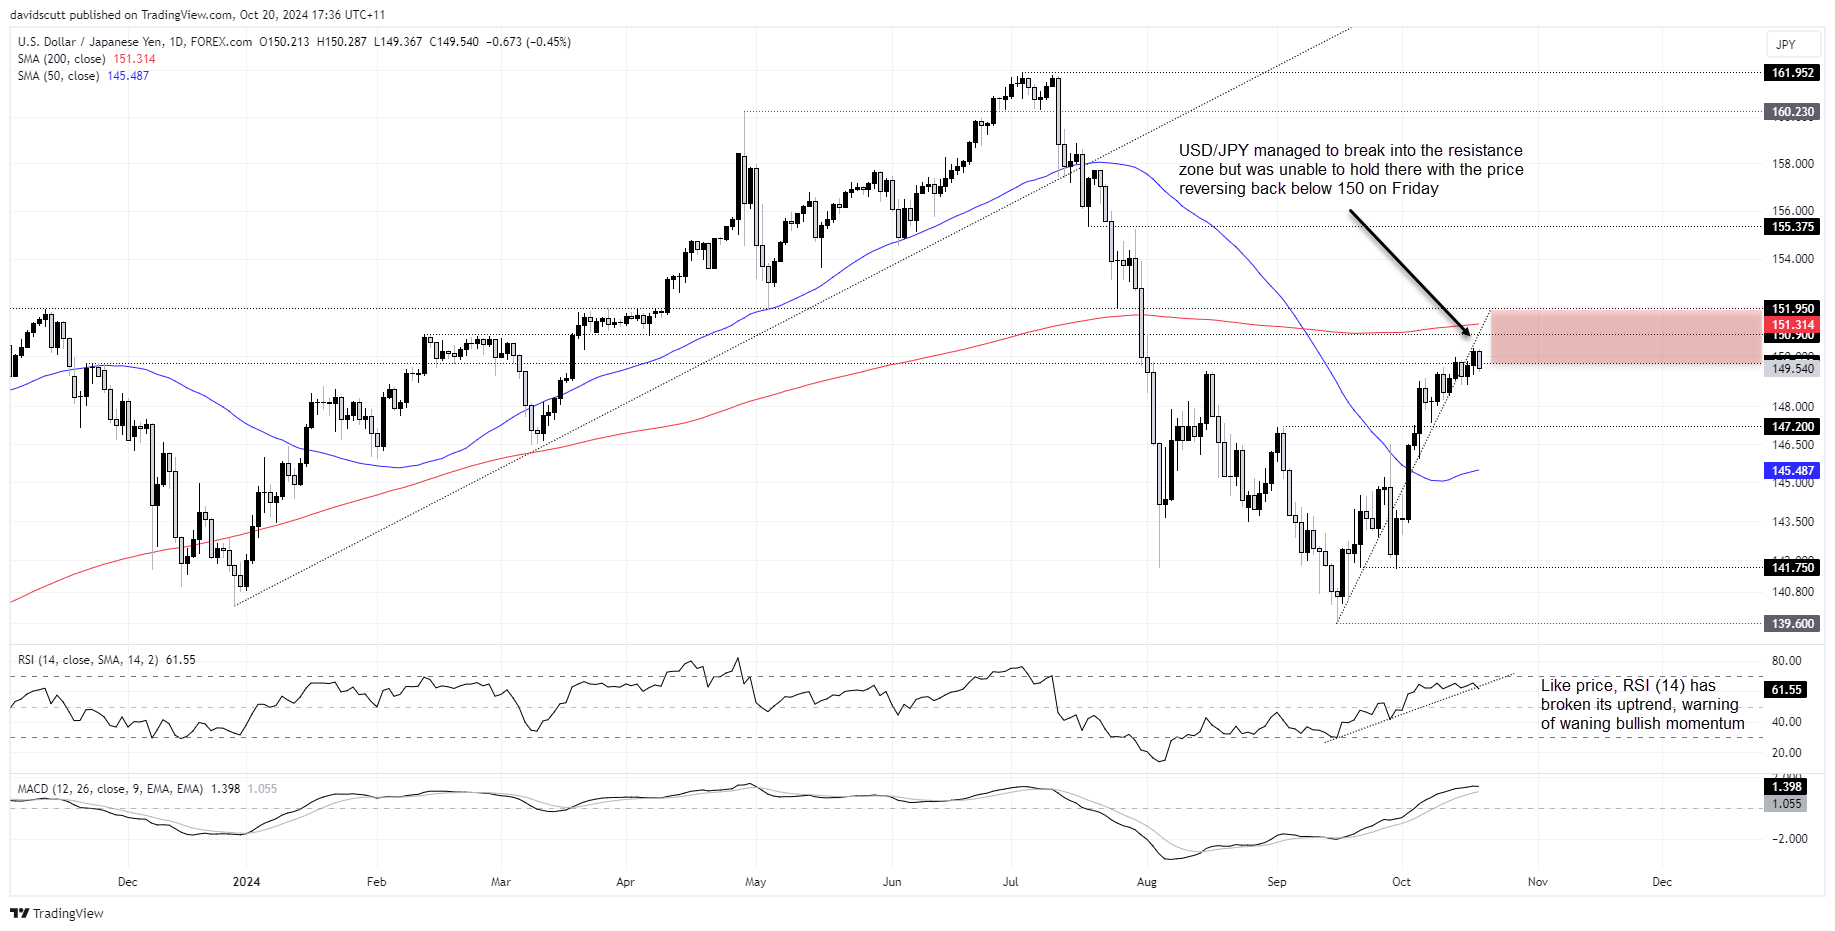
The resistance zone overhanging USD/JPY between 149.75 to 151.95 has been described as formidable in recent posts, comprising multiple long-running horizontal levels and 200-day moving average. The price managed an exploratory probe above 150 last week on the back of the strong US retail sales report. However, the stay didn’t last long with the pair sliding back below to end the week.
Friday’s candle wasn’t quite a bearish engulfing but near enough, underlining the view that the easy upside for USD/JPY has already been won. With the price and RSI (14) breaking their respective uptrends, bullish momentum looks to be waning. MACD has yet to confirm the signal, but it too looks heavy. Directional risks may be turning lower.
USD/JPY has attracted bids towards and below 149 over each of the past four sessions, making that a zone to keep an eye on in the near-term. If last week’s low were to be taken out, it could result in a retracement back towards support at 147.20. Above 149.75, 150.33 was the high struck on Thursday, making that a level of note. 150.90 and the 200-day moving average are the next after that.
-- Written by David Scutt
Follow David on Twitter @scutty


