Markets are a bit more stable across the board today as traders navigate another essentially economic data-free day. The fundamental tranquility will likely be rudely interrupted later this week – Key upcoming reports include Chinese trade balance figures tonight, AU employment tomorrow night, the BOE’s Super Thursday festivities, and US Retail Sales / PPI / Consumer data on Friday – but technical concerns and market sentiment should be the primary driver of trade in today’s US session.
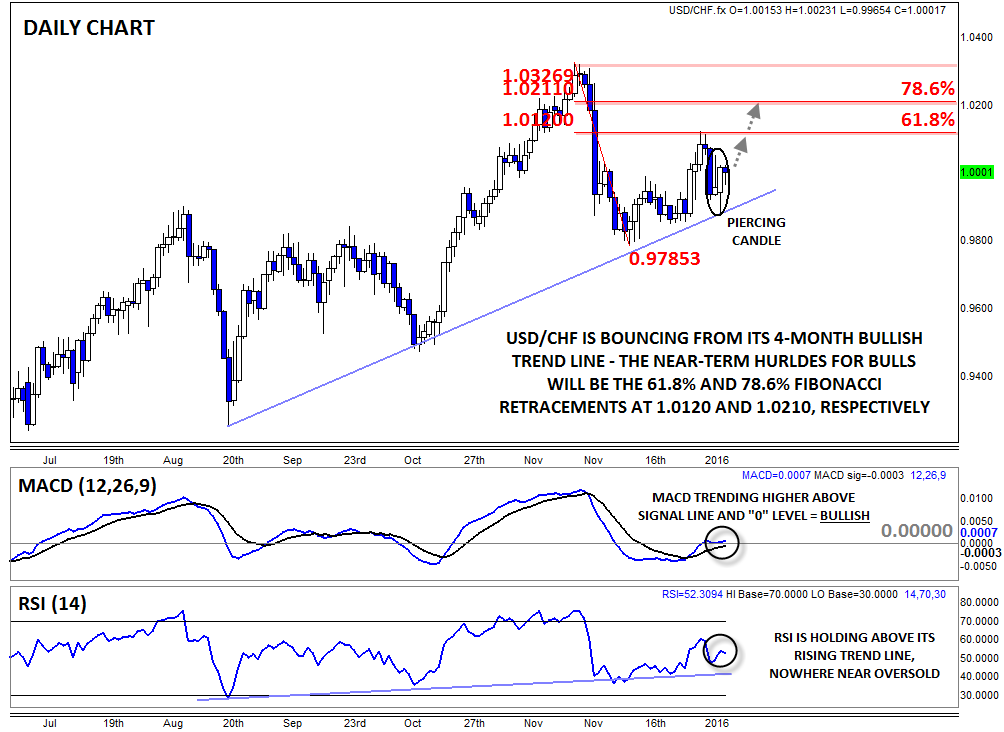
One currency pair that has held up relatively well through 2016’s market volatility is USD/CHF. The unit rallied into 61.8% Fibonacci resistance last week before dropping sharply back to 4-month bullish trend line support to start this week. Yesterday, rates carved out a clear Piercing Candle* pattern, showing an intraday shift from selling to buying pressure and raising the odds of a near-term bottom forming.
The secondary indicators generally support this bullish view: the MACD is trending higher above both its signal line and the "0" level, signalling growing bullish momentum, while the RSI is holding above its own multi-month bullish trend line and is nowhere near overbought territory, where the risks of a near-term dip would grow.
As of writing, the unit has regained the parity (1.00) level, a critical psychological barrier, but there are still a couple of near-term hurdles to monitor before bulls can wave the "all clear" flag. Namely, the 61.8% and 78.6% Fibonacci retracements come in at 1.0120 and 1.0210 and mark areas will selling pressure intensifies. Only if those potential ceilings are overcome will bulls feel confident turning their eyes back toward November’s 5.5-year high at 1.0325.
*A Piercing Candle is formed when a candle trades below the previous candle's low, but buyers step in and push rates up to close in the upper half of the previous candle's range. It suggests a potential bullish trend reversal.

Source: FOREX.com
For more intraday analysis and market updates, follow us on twitter (@MWellerFX and @FOREXcom)


