View related analysis:
China producer prices continue to fall - China A50 set to rally?
Could the PBOC allow USD/CNH to head for 7.000?
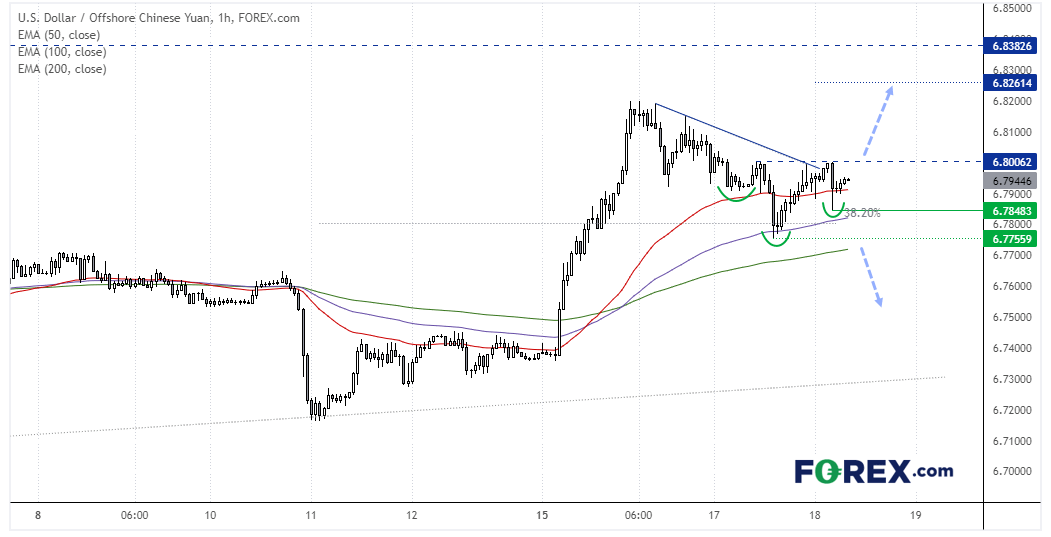
USD/CNH 1-hour chart:
We outlined a bullish case for USD/CNH on Tuesday and for its potential to rise to 7.000. Whilst the US dollar was stronger overnight, a potential inverted head and shoulders pattern has formed on the 1-hour chart. A break above 6.8010 confirms the bullish reversal pattern and projects a target around 6.8260. The bias remains for a bullish breakout whilst prices remain above the 6.7848 low, but we’d need to see a break beneath the 6.7755 low before switching to a bearish bias as this invalidates the current corrective low.

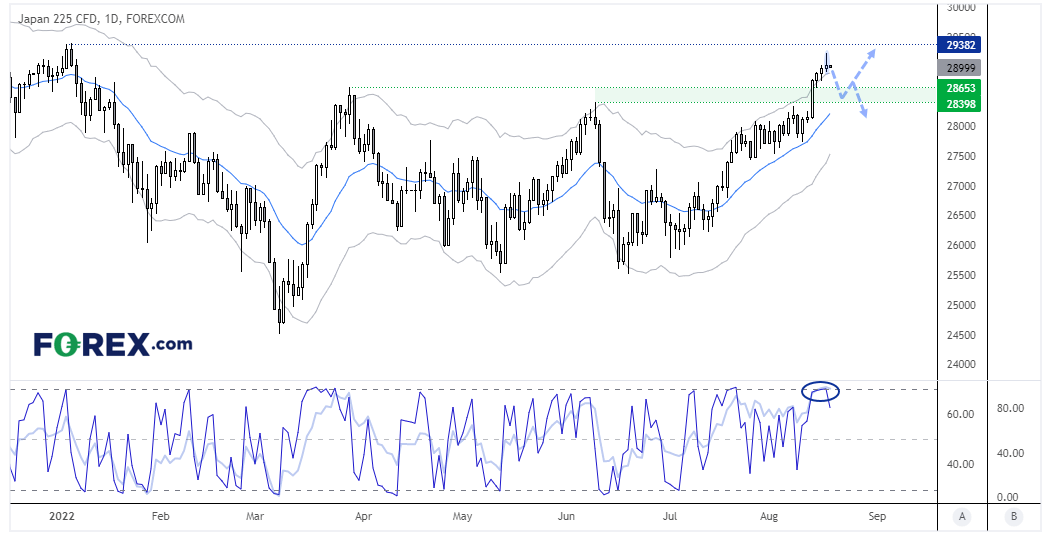
Nikkei 224 Daily Chart:
The Nikkei is trading at its highest level since January, but there are signs it wants to mean revert as part of a retracement. A bearish hammer formed on the daily chart below 29,382 resistance. We have seen four consecutive closes above the keltner channel and yesterday’s hammer warns of trend exhaustion. The RSI 14 is overbought, and the RSI 2 has moved lower from its overbought zone. The 28,398 – 28,635 zone is a potential area of interest for bears, or bulls can wait for evidence of a swing low in this area before reconsidering longs.

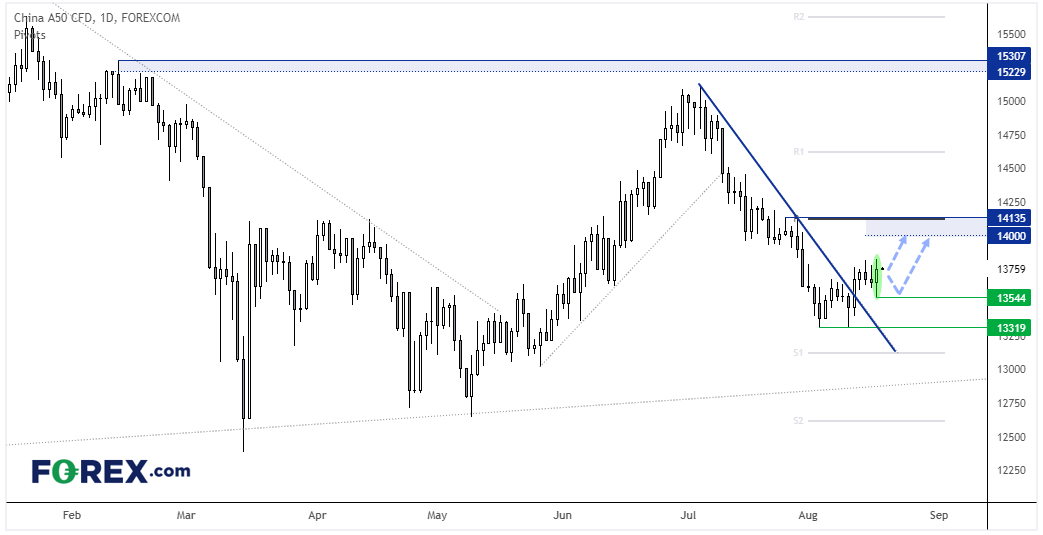
China A50 Daily Chart:
A bullish outside day formed on the China A50 which suggests 13,544 could be a swing low. We’re still looking for prices to rise to the 14,000 / 14.135 after the market broke above the bearish trendline last Thursday. From here we would like to seek evidence of an intraday swing low above 13,544 or wait for a break of yesterday’s high to assume bullish continuation.

How to trade with FOREX.com
Follow these easy steps to start trading with FOREX.com today:
- Open a Forex.com account, or log in if you’re already a customer.
- Search for the pair you want to trade in our award-winning platform.
- Choose your position and size, and your stop and limit levels.
- Place the trade.


