Talking Points:
- Up until the past two years, the 2-10 spread was one of the most reliable, macro signals of a US recession
- Despite a 625-trading day – 889-calendar day – period of inversion by the yield curve, the NBER never called an official ‘recession’
- The infusion of stimulus into the system and a ‘clarification’ by the NBER on definitions likely influenced the signal – but it may yet still just be a delayed reading
While many traders take fundamental indicators and event risk as definitive and timely insight on the health of the economic or financial backdrop, there are a range of issues that exist with most measures. An update like an official government quarterly GDP reading for example is usually three or more weeks delayed and advanced readings are prone to significant adjustment as the sample size used to represent the whole economy is too small.
Another issue with event risk is the skew that anticipation creates. For example, a 500,000 net increase in US nonfarm payrolls in a month can be extraordinarily bullish if the average month’s change is a net 75,000 increase. Then again, if forecasts were for a 700,000 addition because of seasonal hiring; that could be a material disappointment.
Then there are considerations of events and measures whereby some degree of interpretation is required. One of the indicators that falls into this category is the differential between the US 10-year and 2-year Treasury yields – otherwise known as the ‘2-10 spread’. This measure has a history as a ‘recession’ gauge when the curve ‘inverts’ (when the 2 year yield is higher than the 10 year). Normally, borrowing money for a longer term to the US government renders a higher return because of the greater risk that something can go wrong over the duration of exposure. That changes when certain near-term issues seem to override a sense of longer-term stability.
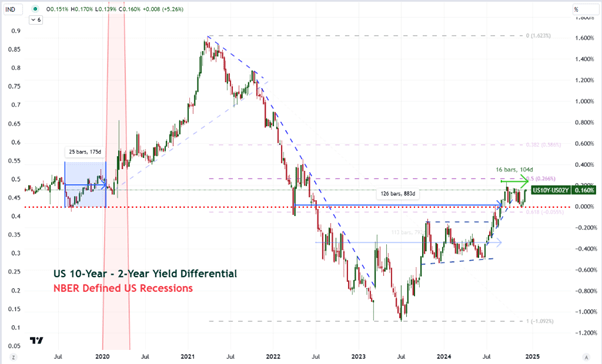
Chart of the US Treasury 10-Year – 2-Year Yield Differential and NBER-Defined Recessions (Daily)

Source: TradingView, John Kicklighter
Looking back over the past 50 years, there have been seven NBER-defined US recessions, and each of them was preceded by an inversion of the 2-10 spread. The gaps between the event from the yield curve and the official recession being called by the National Bureau of Economic Research (NBER) has varied as the circumstances in driving the yields has been different – such as the complete shutdown of the economy during the 2020 pandemic to the gradual malaise leading into the recession of the early 1990s. However, the official call would eventually call.
The signal-confirmation connection held true consistently over time, and though the sample size was generally smaller, the scope of time over which it worked reflected on a strong measure. And, then the track record met an anomaly. Starting in July 2022 (setting aside a short-lived blip earlier in April), the 2-10 spread inverted and remained under water until September 6, 2024. That was 889 calendar days or 625 trading days of inversion. And as of the end of 2024, the NBER had still not called an official recession for the world’s largest economy.
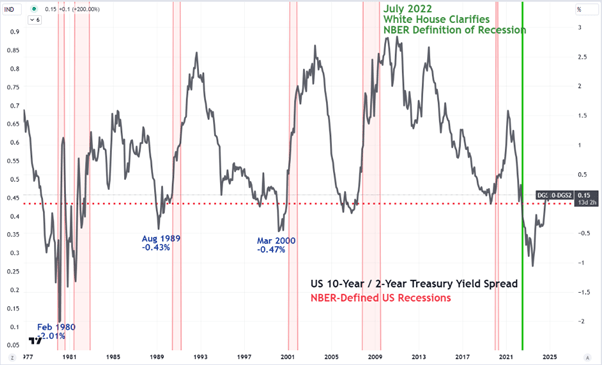
Chart of the US Treasury 10-Year – 2-Year Yield Differential (Monthly)

Source: TradingView, John Kicklighter
An interesting consideration around the formality of that designation – which can lead to significant policy changes, business decisions and consumer confidence shifts – is that the NBER issued through the Federal Reserve in July of 2022 when the inversion began a clarification on its definition. It had become the case that market participants simply equated an inversion of the spread (economists it could be argued preferred the 10-year and 3-month curve) as the defining feature. However, it was emphasize that the NBER considered a recession “a significant decline in economic activity that is spread across the economy and that lasts more than a few months” and it further considered “depth, diffusion and duration”. These elements could certainly be argued over the past few years, but I nevertheless consider the timing of the clarification suspect.
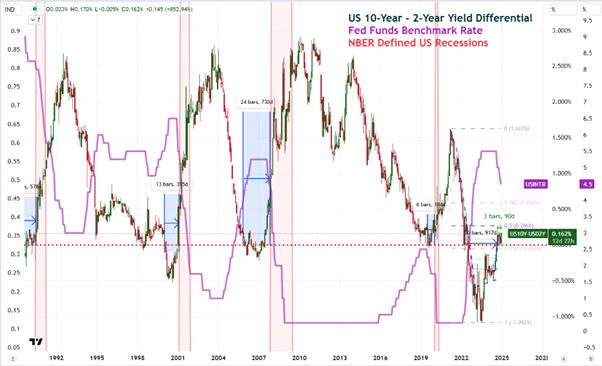
Chart of the US Treasury 10-Year – 2-Year Yield Differential, Fed Funds Rate and NBER-Defined Recessions (Monthly)

Source: TradingView, John Kicklighter
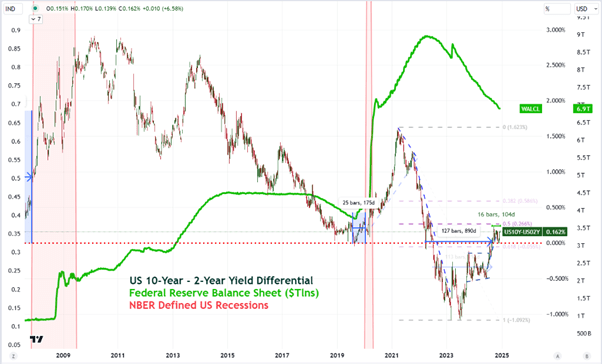
Distortions to the veracity of the yield spread as an indicator are certainly possible when we consider the external influences that can divorce yields from economic activity and financial market performance. In particular, the hold over of abundantly accommodative monetary policy well after the Great Financial Crisis and Great Recession of 2008 has added structural skews that will continue to play out for years. Unrelenting speculative complacency whereby expectations of an ever-ready ‘central bank put’ driving investors to discount real risks – which is a similar source to the previously mentioned stimulus – can be another influence.
Chart of the US Treasury 10-Year – 2-Year Yield Differential, Fed Balance Sheet and NBER-Defined Recessions (Weekly)

Source: TradingView, John Kicklighter
It is possible that the 2-10 spread as an indicator has broken, but I think it far more likely that a unique set of circumstances may have simple challenged the boundaries of its signalling. If the indicator was never meant to account for a world of extreme stimulus and its eventually winddown, then it would not be unreasonable to see it give off a ‘false signal’. And then again, it may not be a false signal. It could also be a situation in which the turning of the gauge has been more intensified to in turn give a far earlier positive than has been seen before. There have been varying gaps between when the start of a period of inversion occurred and when the NBER marked the official recession. Perhaps that is still in the cards for 2025…
-- Written by John Kicklighter, Global Head of Content


