For any medium-term traders tracking NZD/USD, the kiwi has been rather dull of late. The pair has carved out a roughly 500-pip range from .6300 up to .6900 over the last eight months, and over the last week, rates have been essentially stationary in the middle of that range around .6650. At first glance, the technical bias is definitively neutral.
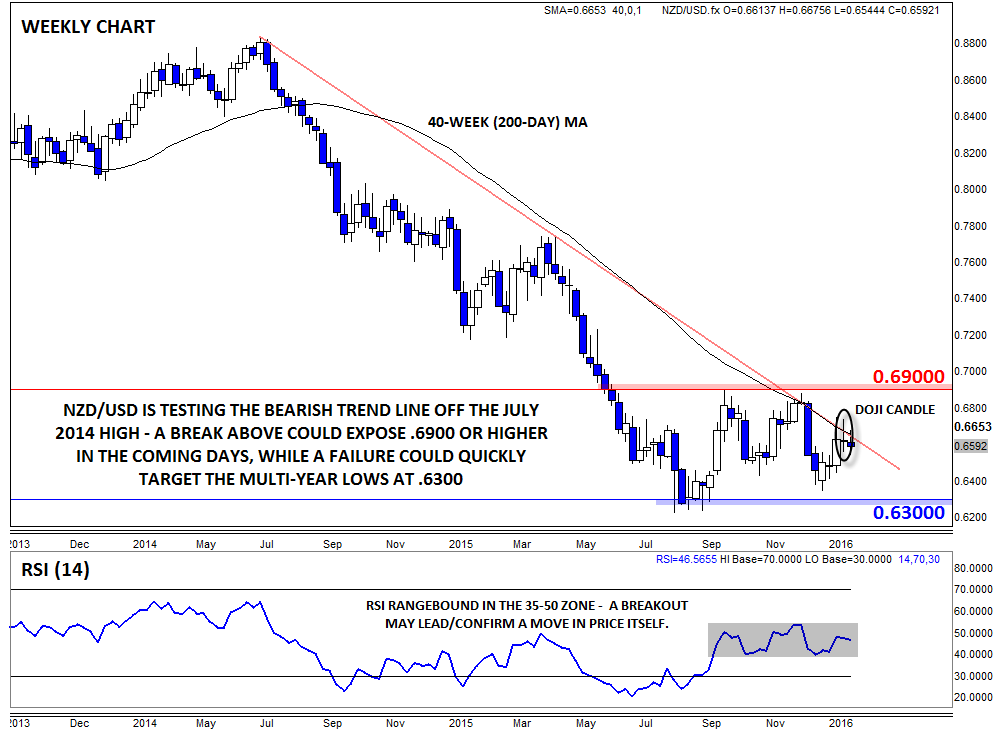
However, traders must also be sure not to miss the long-term forest by focusing excessively on the near-term trees. Zooming out to the weekly chart (below) reveals that the .6650-.6700 region that capped rates last week is a major long-term resistance zone. Most importantly, the bearish trend line off the July 2014 high comes in around .6650, and this barrier has capped NZD/USD on two occassions in the past year, including in December.
In addition, the downward-trending 40-week (200-day) MA comes in at the exact same level, suggesting that a variety of technical traders will be closely watching to see if kiwi can break above that level later this week. From a price action perspective, last week’s market moves created a weekly Doji* candle, signalling indecision in the market as the bulls and bears battle over this critical level.
If NZD/USD can break (and ideally finish the week) above the critical .6650-.6700 region, it would suggest that the long-term downtrend may finally be ending and open the door for a move up toward the top of the near-term range at .6900 as we head into March. On the other hand, another big drop off this resistance level could prompt the unit to fall back down to its multi-year lows in the .6300 zone. As a final note, technical traders may want to focus on the weekly RSI indicator for a break beyond its current 35-50 range to lead or confirm the move in the exchange rate itself.
*A Doji candle is formed when rates trade higher and lower within a given timeframe, but close in the middle of the range, near the open. Dojis suggest indecision in the market.

Source: FOREX.com
For more intraday analysis and market updates, follow us on twitter (@MWellerFX and @FOREXcom)


