Japanese Yen Technical Forecast: USD/JPY Weekly / Daily Trade Levels
- USD/JPY poised to snap four-week advance- outside-weekly reversal off resistance
- USD/JPY threatens larger correction within September uptrend
- Resistance 156.67 (key), 158.45, 160.40- Support 154.89, 152.70-153.40 (key), 151.84-152.03
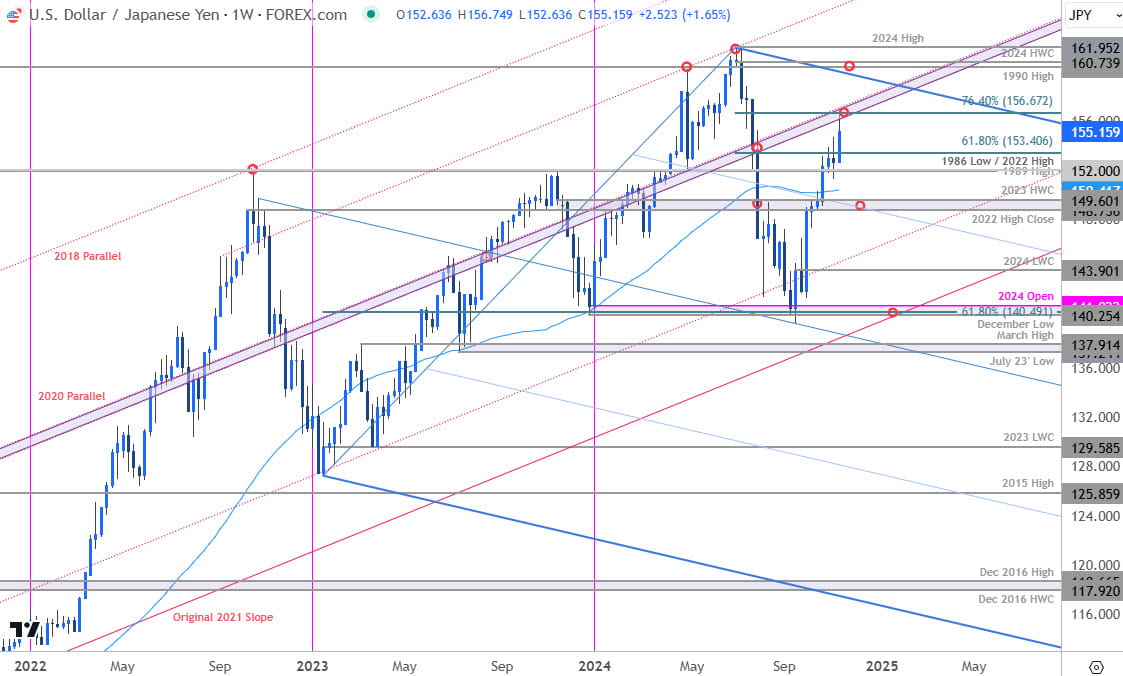
The US Dollar is set to snap a four-week winning streak against the Japanese Yen with USD/JPY with the post-election rally poised to close an outside-weekly reversal of technical resistance. While the broader outlook remains constructive, the near-term threat now shifts towards a larger correction within the broader multi-month uptrend. Battle lines drawn on the USD/JPY weekly & daily technical charts.
Review my latest Weekly Strategy Webinar for an in-depth breakdown of this Yen setup and more. Join live on Monday’s at 8:30am EST.Japanese Yen Price Chart – USD/JPY Weekly

Chart Prepared by Michael Boutros, Sr. Technical Strategist; USD/JPY on TradingView
Technical Outlook: In last month’s Japanese Yen Technical Forecast we noted that the USD/JPY rally was, “testing technical resistance this week and while near-term outlook remains constructive, the immediate advance may be vulnerable into this threshold. From a trading standpoint, a good zone to reduce long-exposure / raise protective stops- losses should be limited to the 200 DMA IF Price is heading for a breakout with a close above 153.40 needed to mark uptrend resumption.”
USD/JPY fell nearly 1.7% in the following days with the 200-day moving average catching the decline into the start of the month. The post-election rally extended more than 3.6% off those lows before exhausting with price now poised to mark an outside-weekly reversal off Fibonacci resistance at the 76.4% retracement of the yearly range near 156.67- risk for a deeper pullback within the broader multi-month uptrend.
Japanese Yen Price Chart – USD/JPY Daily

Chart Prepared by Michael Boutros, Sr. Technical Strategist; USD/JPY on TradingView
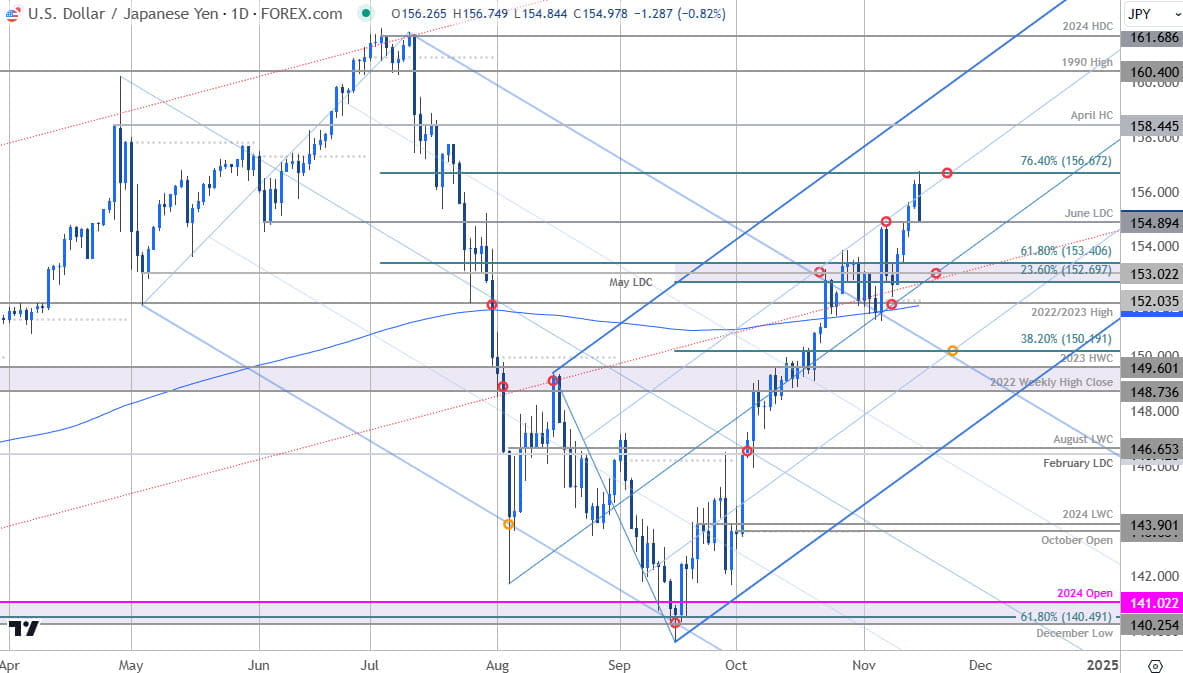
A closer look at the daily chart shows USD/JPY failing to hold a close above the 75% parallel of the ascending pitchfork we’ve been tracking off the September lows. Note that daily momentum continues to signal bearish divergence and further highlights the threat to the medium-term advance.
Initial support now rests with the June low-day close (LDC) near 154.89 backed by 152.70-156.40- a region defined by the 23.6% retracement of the September advance, the May LDC, and the 61.8% retracement of the yearly range. Broader bullish invalidation now raised to the 200-day moving average / 2022 & 2023 swing highs / November open at 151.84-152.03- look for a larger reaction there IF reached. Losses below this threshold would suggest a more significant high was registered this week.
A topside breach / close above this week’s high exposes subsequent resistance objectives at the April high-close (HC) at 158.45 and the 1990 high at 160.40. Note that the upper parallel converges on this threshold into the December open.
Bottom line: USD/JPY has responded to Fibonacci resistance with price poised to mark an outside-reversal on the heels of a four-week rally- risk for a larger pullback within the broader uptrend. From a trading standpoint, losses should be limited to the median-line / 153 IF price is heading for a breakout on this stretch with a close above 156.67 needed to mark uptrend resumption. I’ll publish an updated Japanese Yen Short-term Outlook once we get further clarity on the near-term USD/JPY technical trade levels.
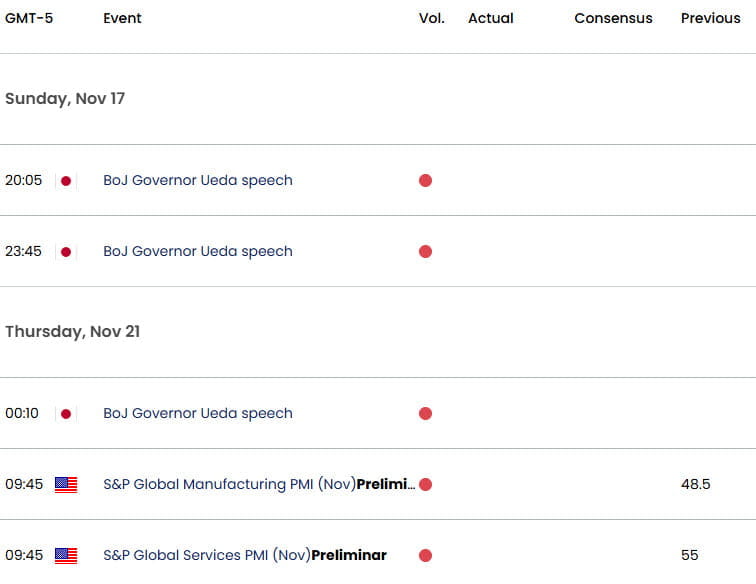
USD/JPY Key Economic Data Releases

Economic Calendar - latest economic developments and upcoming event risk.
Active Weekly Technical Charts
- Crude Oil (WTI)
- British Pound (GBP/USD)
- Euro (EUR/USD)
- Canadian Dollar (USD/CAD)
- Swiss Franc (USD/CHF)
- US Dollar Index (DXY)
- Australian Dollar (AUD/USD)
- Gold (XAU/USD)
- Silver (XAG/USD)
--- Written by Michael Boutros, Sr Technical Strategist
Follow Michael on X @MBForex


