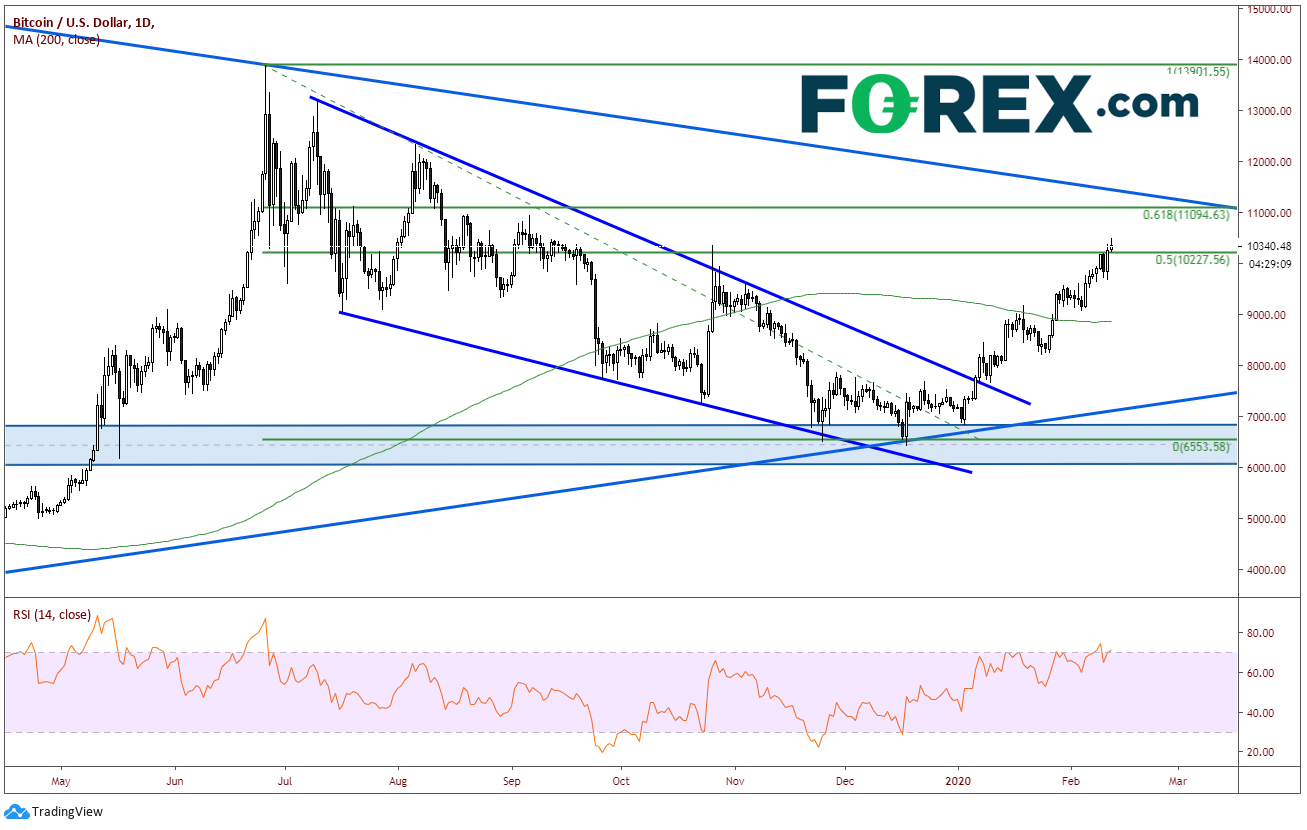
Bitcoin (BTC)….the darling of crypto coins. My colleague, Matt Weller, discussed earlier today how the price of bitcoin has been slowly rising above $10,000, currently trading near $10,325. He also writes how BTC many be ready for a pause in the 40%+ ascension since the beginning of the year. Price action today put in a shooting star on the daily timeframe, while retracing to 50% of the move from the highs on June 25th, 2019 to the lows on December 18th at $10,245. The RSI is beginning to diverge as it tries to pull back after today’s candle. Still, BTC is up .71% on the day.

Source: Tradingview, FOREX.com
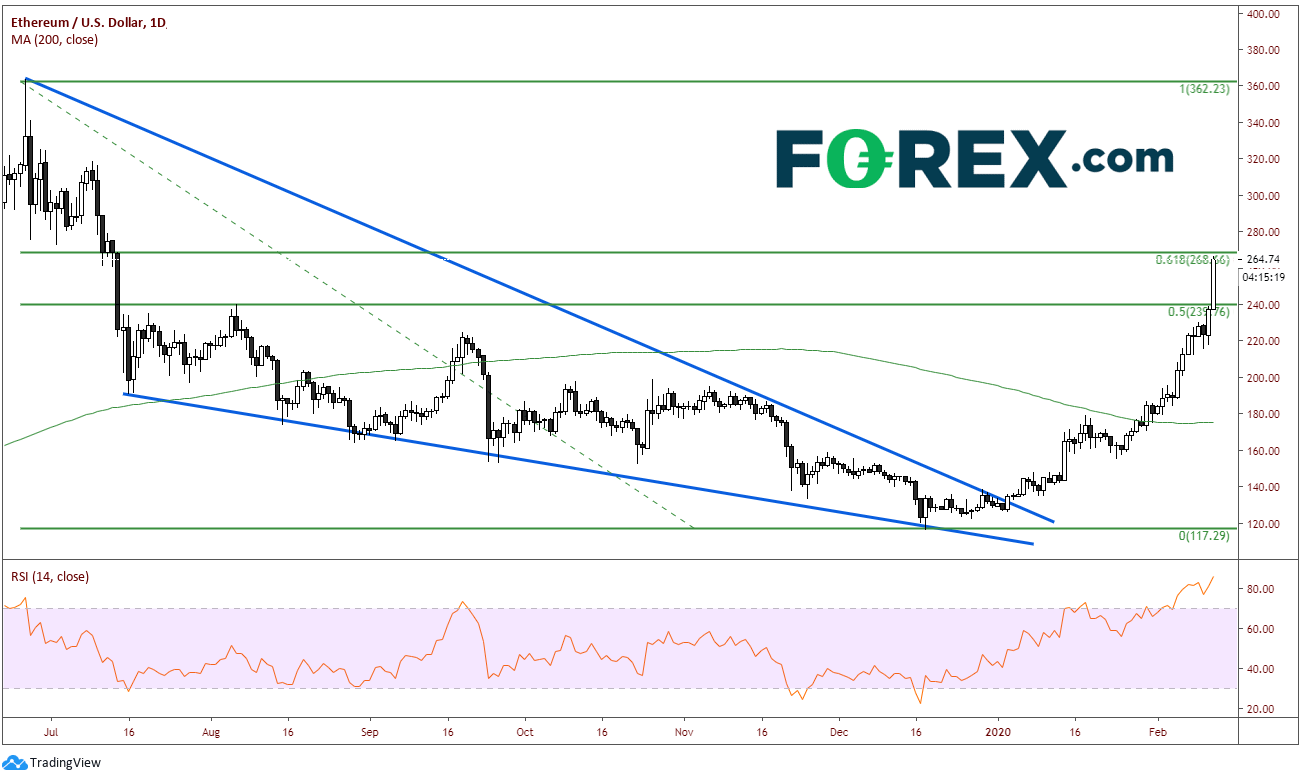
Back in 2017, there were other closely monitored cryptos which took flight along with BTC, such as Ethereum (ETH), Litecoin (LTC), and Ripple (XRP). As with BTC, ETH put in a high on June 25th at $317.84. Again, as with BTC, price fell to horizontal support near 117.29, and broke higher, out of a falling wedge. And again, just as with BTC, price rose to the 50% retracement level from the June 25, 2019 high to the December 17th lows at 239.76. Here is where the similarities end. ETH is trading up near the 61.8% retracement level from the previously mentioned timeframe at $264, UP +11.25% ON THE DAY!! True, the RSI in is in extreme overbought territory, but it is still pointing up.

Source: Tradingview, FOREX.com
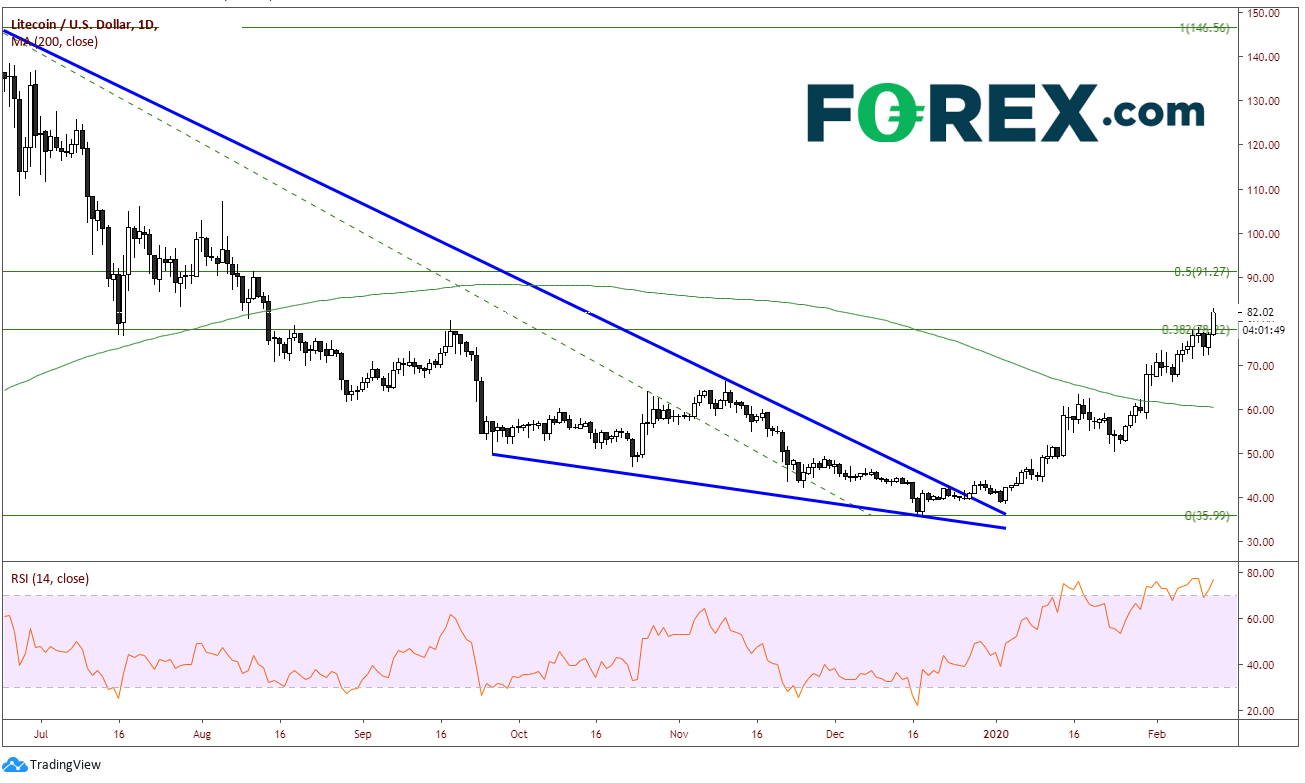
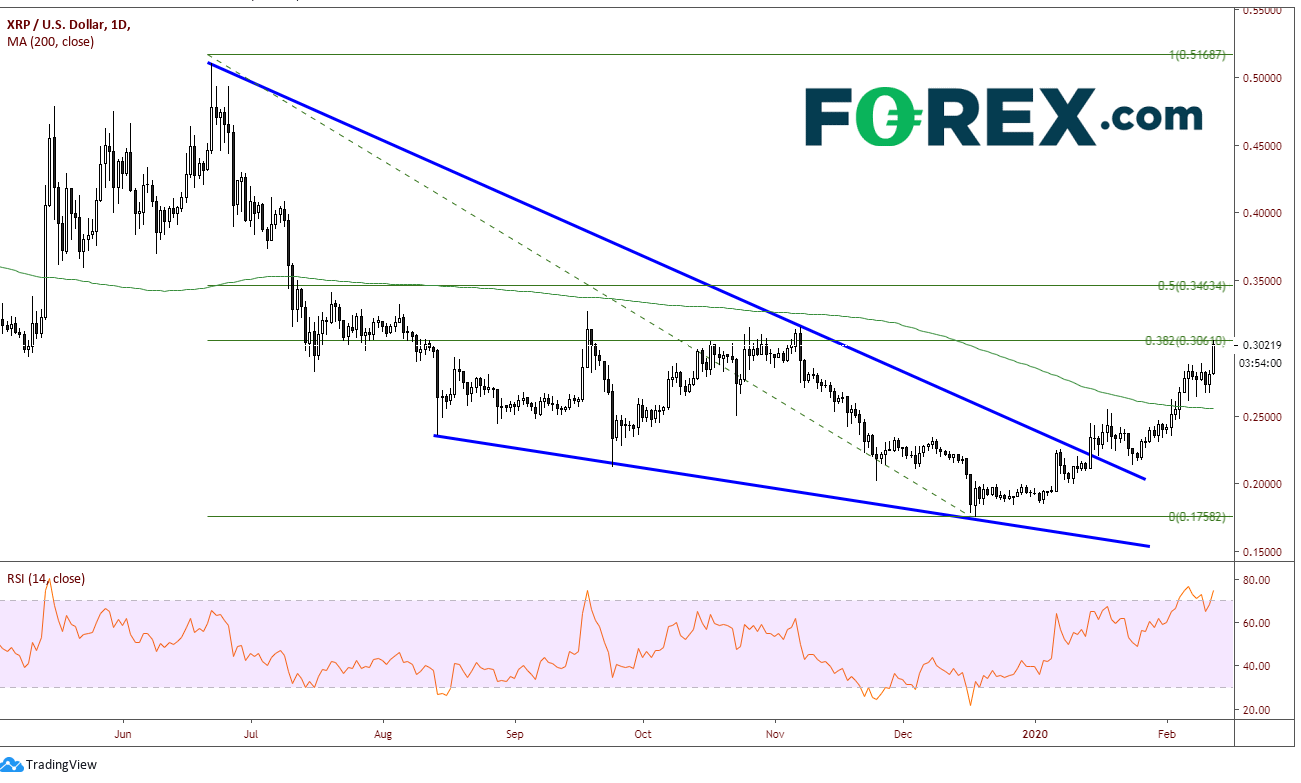
Not the be outdone, LTC and XRP have moved in similar fashion to BTC and ETH. Both moved lower from the June highs, and both broke higher out of falling wedge formations in later December 2019. However, both LTC and XRP have only been able to retrace to the 38.2% level from the June 2019 highs to the December 2019 lows. Still, LTC is at $82.15, up 6.7% today, while XRP is at $.3029, up 7.55% today. Notice once again how the RSI’s are also in overbought condition but are still pointing higher.
LTC

Source: Tradingview, FOREX.com
XRP

Source: Tradingview, FOREX.com
In summary, XRP and LTC have only retraced 38% of the move from June 2019 to December 2019, while BTC and ETH have retraced 50% and 62%, respectively. In addition, BTC is already showing signs it may turn lower.
There’s information in that: It appears that LTC and XRP are only moving higher because of BTC and ETH. If BTC and ETH do pull back, watch for LTC and XRP to pull back at a faster pace than BTC and ETH!


