- Gold outlook faces pressure from strong yields and dollar
- Busy week ahead with key US employment figures and company earnings
- Technical patterns hint at a potential reversal; watch for confirmations
Has Gold Peaked or Just Paused?
After reaching fresh record highs earlier this week, gold prices have pulled back, raising questions about whether we’ve seen a short-term peak or just a temporary pause in the rally. It is the lack of fresh bullish drivers that has kept the metal’s gains in check this week. If anything, we have had more bearish fundamental reasons for the rally to pause, or even reverse. The dollar's strong rally in recent weeks and the simultaneous climb in bond yields are clear headwinds for the metal, as they increase the opportunity cost of holding zero-interest assets like gold. Up until the latter parts of this week, these considerations have been largely ignored. But now that we are seeing the bullish momentum fade somewhat, and prices remaining at significantly overbought technical levels on the higher time frames, even some of the most bullish enthusiasts would find it difficult to maintain a short-term bullish gold outlook, without first seeing a bit of a pullback in prices at the very least. The question is whether that motion has now started or does this phase of the weakness yet again prove to be short-lived before we see new highs. Next week is a busy one for the economic calendar with lots of US economic data, the BoJ’s policy meeting and lots of major company earnings all to come ahead of the November 5 US Presidential election in the following week.
Dollar and Bond Yields: A Double Burden on Gold Outlook
While bond yields fell on Thursday, they remain near their recent highs at around 4.2%. By holding gold instead of the US 10-year bonds, investors are effectively forgoing a fixed annual nominal return of over 4%. Their preference for gold must therefore be because of expectations for 1) even higher gold prices i.e., capital appreciation 2) inflation acceleration, 3) haven demand, or more likely, a combination of these factors. But it is also common that people like to buy things when they are going up, in part because of FOMO, and so momentum is another factor driving gold prices even higher. But with yields now above 4%, and the dollar going from strength to strength, you would seriously have to consider the downside risks for gold from here on.
Though I have long been a gold bull and expected prices to near the $3K mark, the fact that we have now seen a big rise in yields and the dollar means some of bullish arguments for gold are now no longer relevant. So, I can’t see gold maintaining its rally without a change in direction of either the dollar or bond yields, or a major escalation in the Middle East tensions such as a real war breaking out between Iran and Israel.
But gold’s haven appeal is now less of a bullish factor. Israel’s recent statement that it isn’t planning to escalate tensions with Iran by targeting its oil and nuclear sites, has already seen oil prices – the most sensitive market to Middle East tensions after gold – ease. This assurance should also be impacting gold from a safe haven demand point of view, especially if we hopefully see further de-escalation in the situation in the coming weeks.
Technical View: Possible Reversal Looms
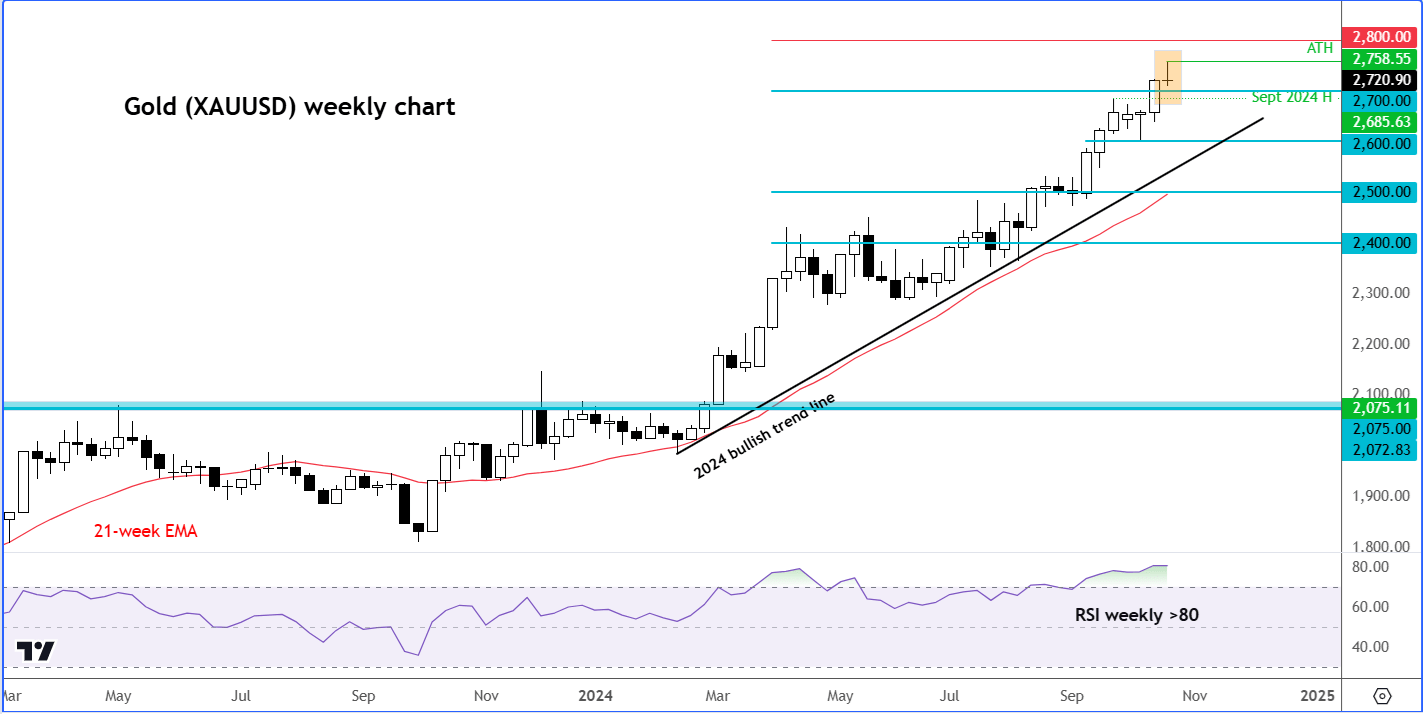
Technically, gold’s recent price action suggests a potential pullback. Despite reaching a new high earlier this week, the momentum has stalled, reflecting a challenge to sustain recent gains against a strong dollar and high yields. With the RSI (Relative Strength Index) already being at extreme overbought levels on the higher time frames like the monthly and weekly, a reversal similar to August 2020—when gold faced months of correction—could be on the horizon. So far, though, we haven’t seen any major reversal patterns such as the breakdown of a key support level to form a lower low, but that could happen soon.
Looking at the weekly chart, we can see gold is on the verge of potentially forming a doji or inverted hammer candle on this time frame. While this on its own wouldn’t be too alarming, the fact that the RSI is deep at “overbought” levels of 80.0 gives it a bit more relevance.

Source: TradingView.com
Next support on the weekly gold chart below $2715 area comes in around $2685, marking the high from September. Below that level, there are not many obvious near-term support levels to watch on the weekly chart, so you will need to look into the lower time frames. But essentially, the RSI situation needs to be addressed either through price action or a long consolidation around these levels. In either case, the risks to short-term gold outlook is therefore tilted to downside as the upside potential should be limited from here on, until such a time that prices are no longer so significantly overbought.
-- Written by Fawad Razaqzada, Market Analyst
Follow Fawad on Twitter @Trader_F_R


