Gold bounced back after initially extending its losses at the start of this week, following last week’s drop. So far, the modest gains are nothing to get excited over, as the dollar index tries to hold steady in what so far has been a quiet week for macro calendar. The economic calendar will get busier as we transition to the second half of the week, but for now all the attention will be on upcoming technology earnings. Later in the week, we will have the release of global PMIs, US GDP and the Fed’s favourite inflation measure – core PCE price index – all of which having the potential to impact the short-term gold forecast.
US dollar trades mixed
The big story so far this week has been about the US presidential race, which got murkier with Joe Biden dropping out, casting a shadow over the dollar's future and the direction of risk assets. Kamala Harris seems to have secured the necessary Democratic support for the Presidential nomination. The competition between Harris and Trump is expected to be close, something which could hold the dollar back. Against the yen, the USD has given back some of the gains from last week, which were driven by expectations of inflationary policies from Trump. But against most other major currencies, the dollar has gained ground, especially against commodity dollars amid the sell-off in crude oil and copper prices, all due to concerns about the health of China’s economy. But the real driver for the dollar is the Federal Reserve’s interest-rate moves. Investors are pretty sure the Fed will start cutting rates in September regardless of which party will win the elections. I think the greenback should start to resume lower once Chinese concerns dwindle, and as the focus shifts back to the economic data as we transition into the second half of the week.
Gold forecast: Technical analysis
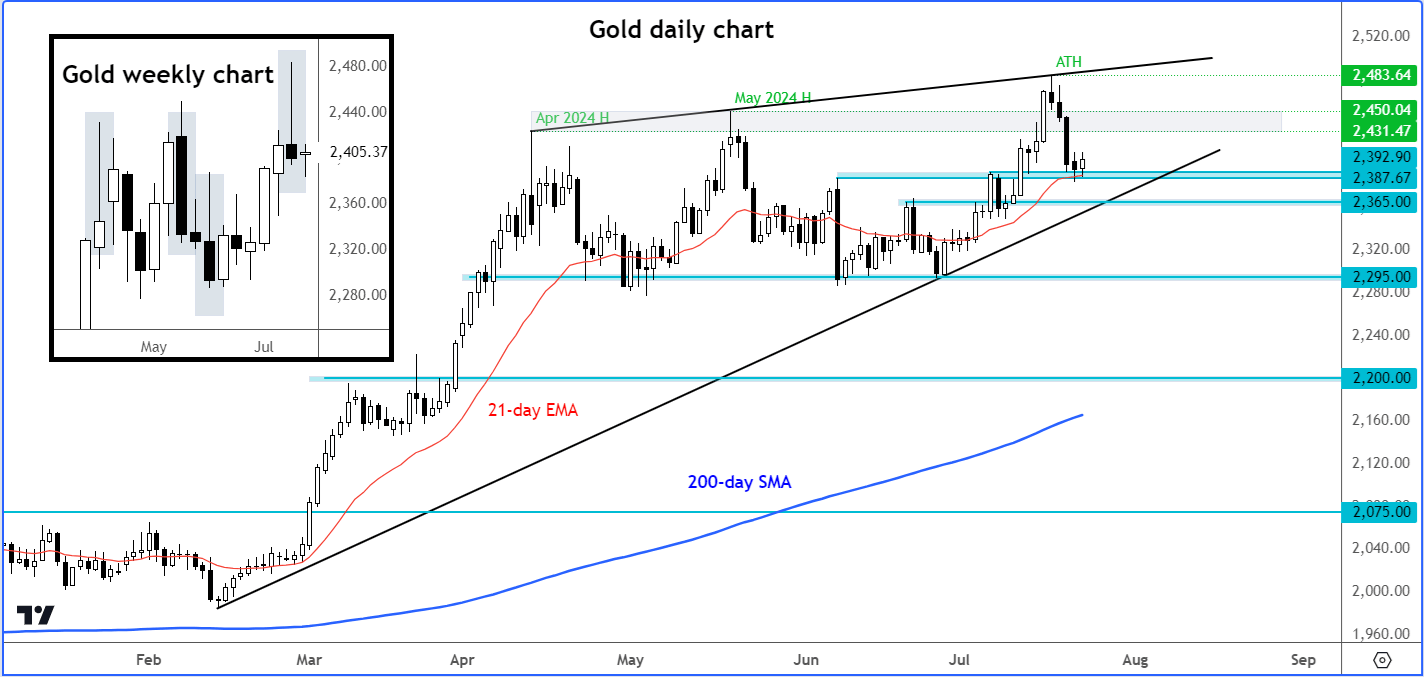
From a technical point of view, gold prices dropped last week, forming an inverted hammer candle after failing to hold above the highs from May and April (see inset). This pattern has raised concerns about a temporary top in gold, but similar bearish signals in the past have not triggered sustained downtrends.

Source: TradingVIew.com
I expect gold to bounce back from current levels, as it seemed poised to at the time of this writing. Looking at the daily gold chart, above, one can see that it is holding above a bullish trend line, the 21-day exponential moving average, and several broken resistance levels around $2387. The next key support level is around $2365, where the trend line converges with prior resistance.
Potential resistance lies between $2431 and $2450, where April and May highs converge. Above this area, the next resistance is the all-time high of $2483.
The trend remains bullish with higher highs and higher lows. As long as a lower low isn't formed, the path of least resistance remains upward. For the bulls to stay in control, one of the abovementioned support levels must hold.
I'm looking for confirmation of the bullish trend resuming at current levels but regardless of the short-term path, my longer-term gold forecast remains bullish.
-- Written by Fawad Razaqzada, Market Analyst
Follow Fawad on Twitter @Trader_F_R


