- US rates outlook heavily influencing moves in precious metals markets
- US June inflation report released on Thursday
- A weak core reading may open the door for the Fed to begin signaling rate cuts
Overview
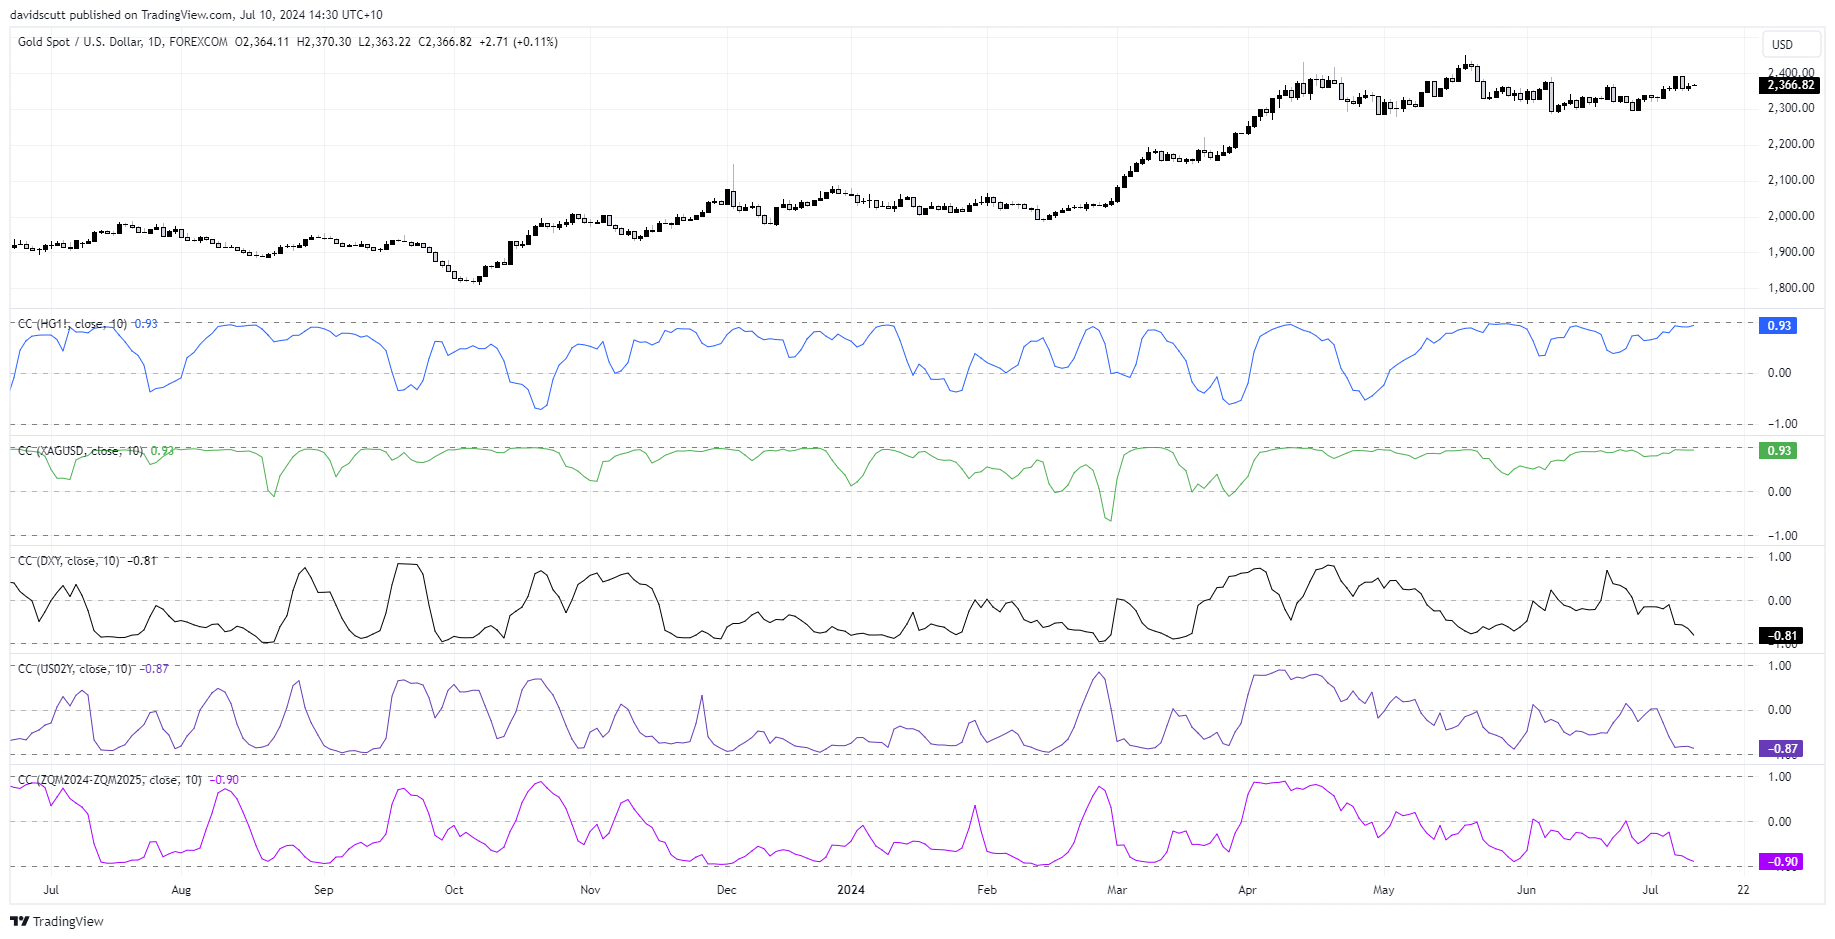
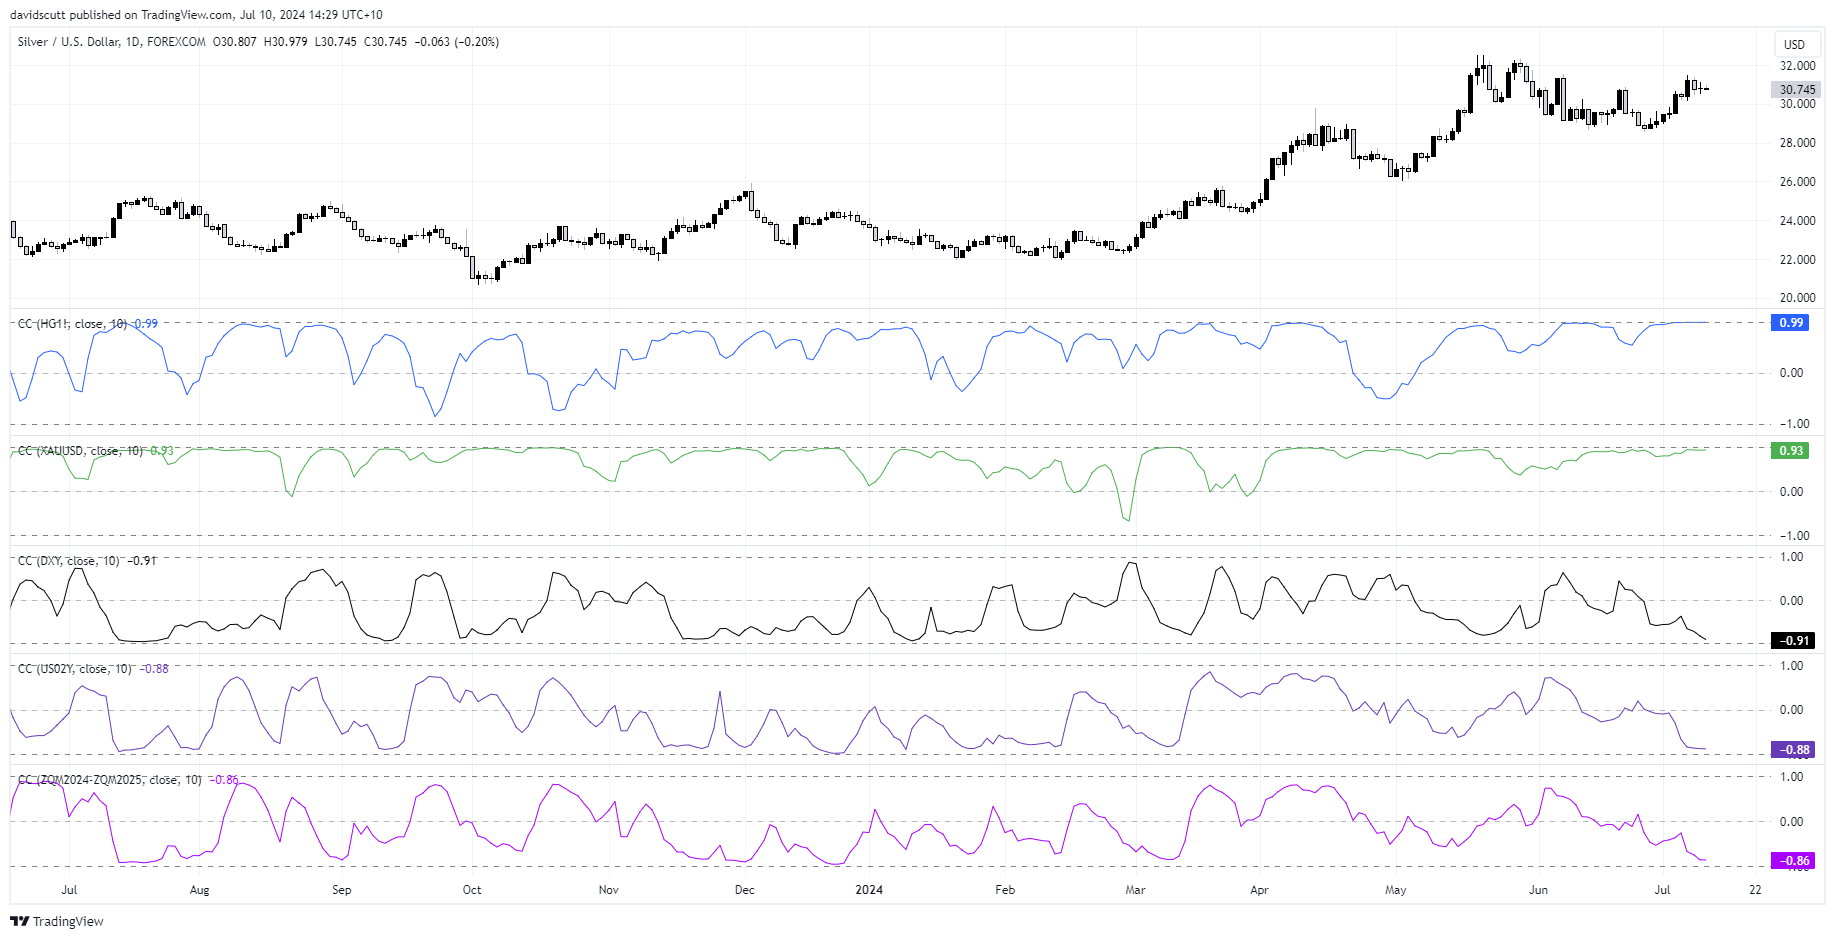
Gold and silver have been strongly correlated with copper futures over the past fortnight. The negative correlation with the US dollar index, US two-year Treasury yields and Fed funds futures curve has also strengthened. Combined, it suggests base and precious metals are once again being driven by the US interest rate outlook.
That makes Thursday’s US inflation report arguably even more important for metals markets, especially with Fed chair Jerome Powell signaling the labour market is no longer an impediment to cutting rates. Should the FOMC receive more “good data” on inflation, it will open the door for the Fed to begin lowering rates, a scenario that may generate upside for gold and silver should existing relationships with FX and rates markets be maintained.
Rates back in the driving seat
Before we look at the technical levels, these charts show the rolling daily correlation between gold and silver with COMEX copper (blue), DXY (black), US two-year yields (mauve) and Fed funds futures curve (pink) over the past ten days. The latter reflects the difference in price between the June 2024 and June 2025 contracts, providing an indication on the amount of rate cuts expected over the next 12 months. The green line is either gold or silver, depending on whether it’s the other being analysed.
A score of 1 means the two variables move in lockstep. A score of -1 means they always move in the opposite direction. The closer to 1 or -1 the score, the stronger the relationship or inverse relationship is with the other variable.
Here are the scores for gold over the past 10 days.

And for silver.

While gold and silver have been strongly correlated for much of the past year, it’s only recently copper has joined the mix. I find that interesting because correlations often strengthen within and across different asset classes when we reach macro turning point, in this case the US rate outlook. Think back to periods in the past when we’ve seen highly correlated “risk on, risk off” moves – they often occur when a big market driver is about to change. It essentially becomes one large trade.
Inflation report provides substantial event risk
Granted it’s only a limited timeframe, but it’s interesting gold and silver are moving increasingly in the opposite direction to the US dollar and bond yields which are often influenced by Fed rates expectations. It suggests that if were to receive another soft US core inflation print on Thursday, it may act to weaken the buck and lower Treasury yields, creating upside risks for base and precious metals.
Even though markets are 70% priced for a Fed cut in September, and still favour two this year, I get the sense the Fed merely signaling looming cuts could generate meaningful downside for the dollar and bond yields. Just think back to last December for evidence of what could happen.
Given the soft nonfarm payrolls report last Friday and Powell’s comments to lawmakers this week, the next few days loom as particularly important. While an upside surprise is always a risk, given increasingly patchy economic data, persistent US dollar strength and the prevailing disinflationary trend, such an outcome appears unlikely.
While CPI is not the Fed’s preferred inflation measure, it is usually a reliable guide on what to expect. As the Fed focuses on underlying inflation, the core reading is likely to be more influential on markets than the headline number. It's expected to increase 0.2% in June, seeing the annual rate remain at 3.4%. Rounding to two decimal places will be important.
Nearer-term, the results of Wednesday’s 10-year Treasury note auction may be influential on other parts of the bond curve, impacting gold and silver prices.
Gold finding buyers at $2350

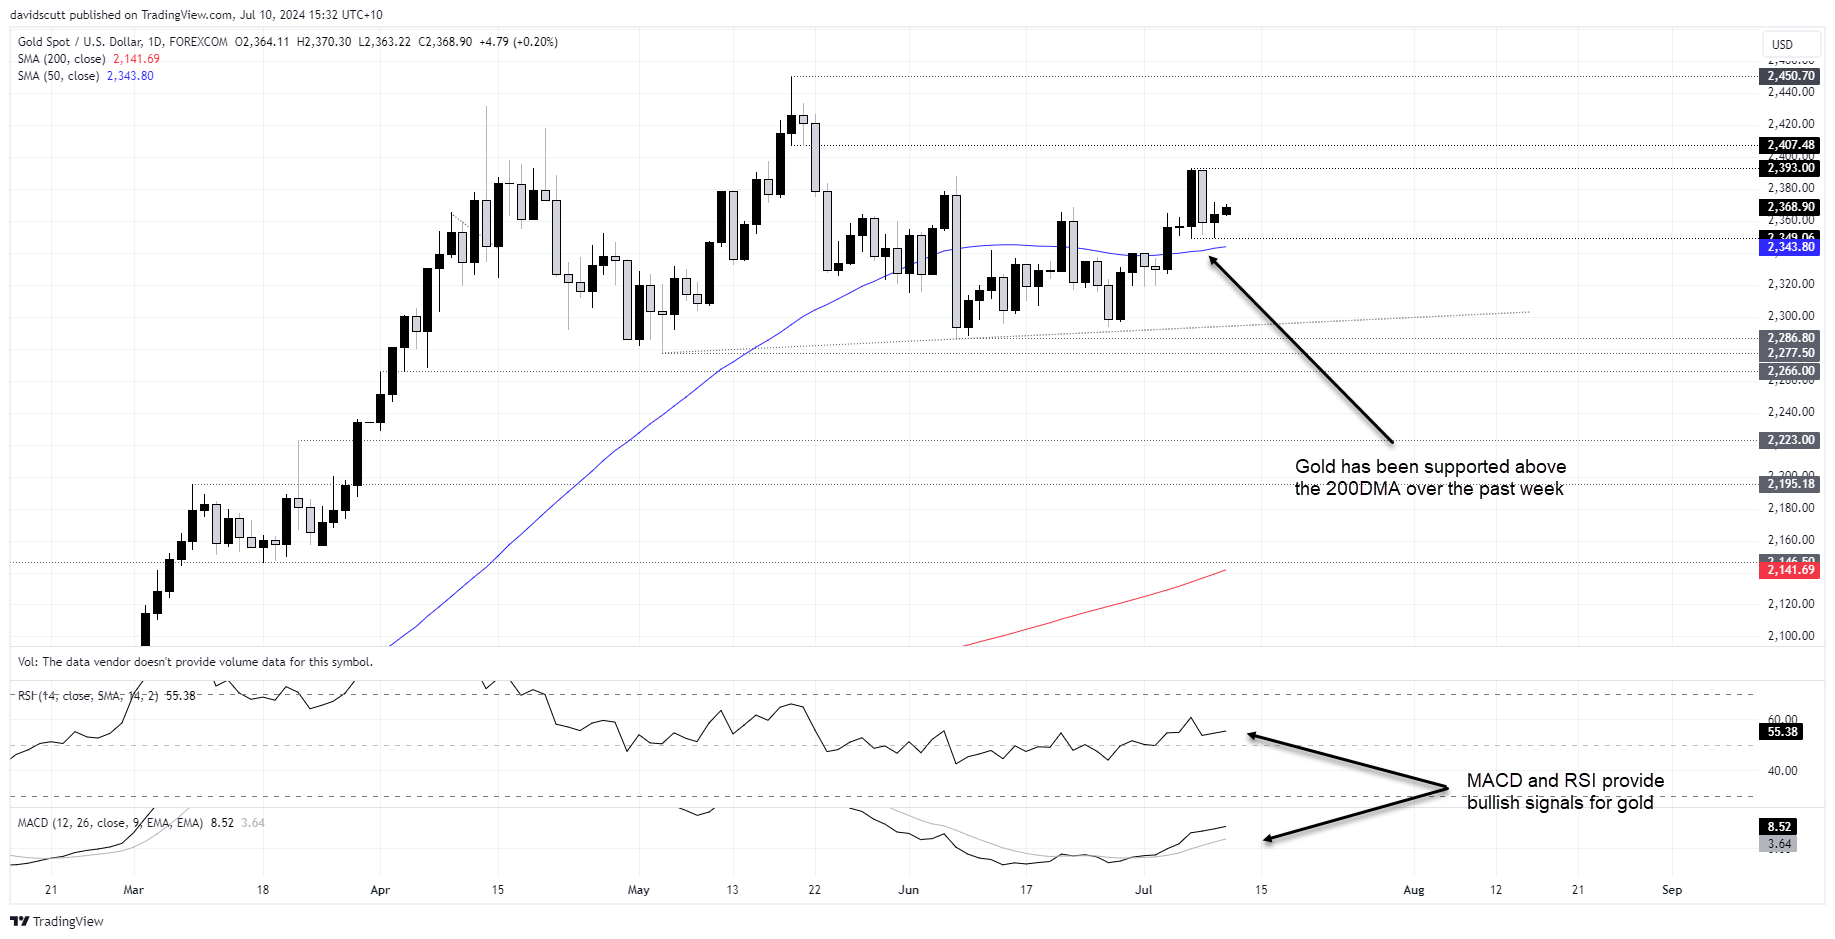
Looking at gold on the daily chart, aside from the big reversal seen on Monday, the notable feature this week is how supported the price has been on dips towards and below $2350. Perhaps it’s the proximity of the 50-day moving average just below at $2343.08, but it bounced from this level in each of the past four sessions prior to today.
Should we receive a soft US inflation report, look for a potential retest of Friday’s high of $2393. Above, $2407.48 is a minor resistance level with the record high of $2450.70 a far tougher test after that. If the inflation print is hot, $2320 may be in play. Below, a support zone is found between $2386.80 and $2266.
Right now, RSI and MACD are generating positive signals on price momentum.
Silver pushes higher after bullish break

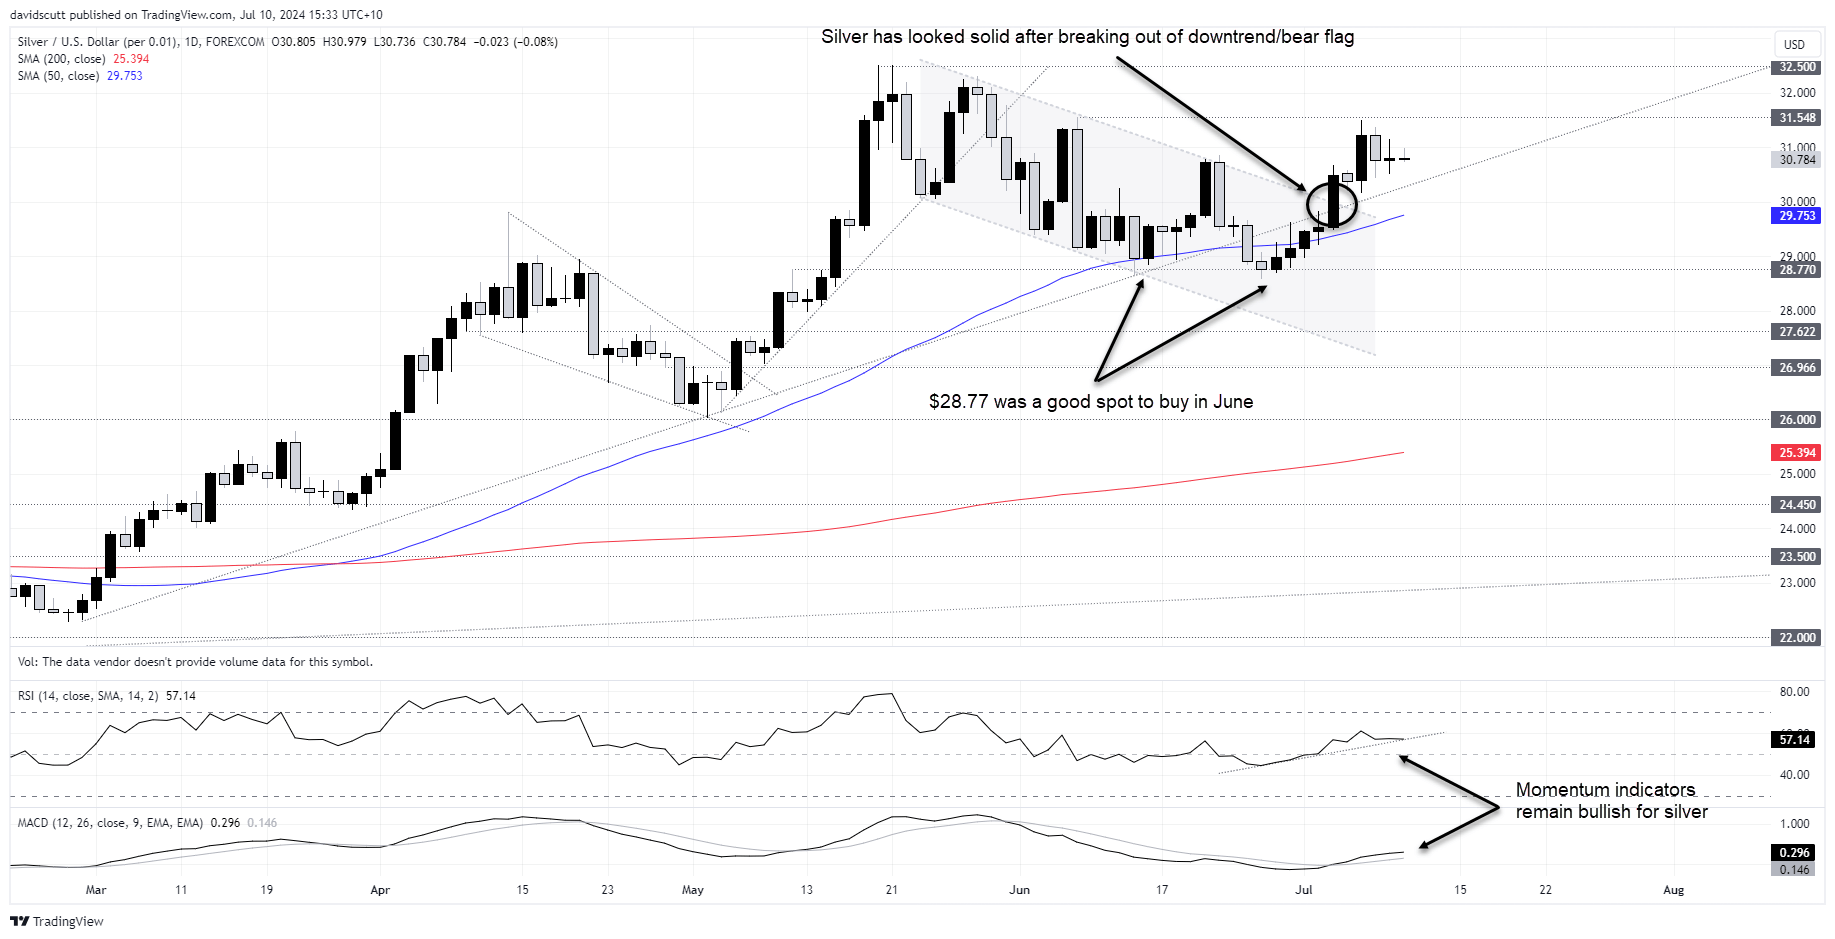
The same message is coming from oscillators for silver which are trending higher after the price broke out of the descending channel late last week, popping back above the former uptrend it had been trading in since the beginning of March.
Buyers have been emerging on pullback towards $30 over the past week with sellers located below $31.548. Should the latter go, the cycle high of $32.50 will be on the radar. $34.38 and $35.36 are the next levels after that.
On the downside, silver found support at $28.77 earlier in the year. Below, $27.622, $26.966 and key support at $26 are other levels to watch.
-- Written by David Scutt
Follow David on Twitter @scutty


