US Dollar Outlook: GBP/USD
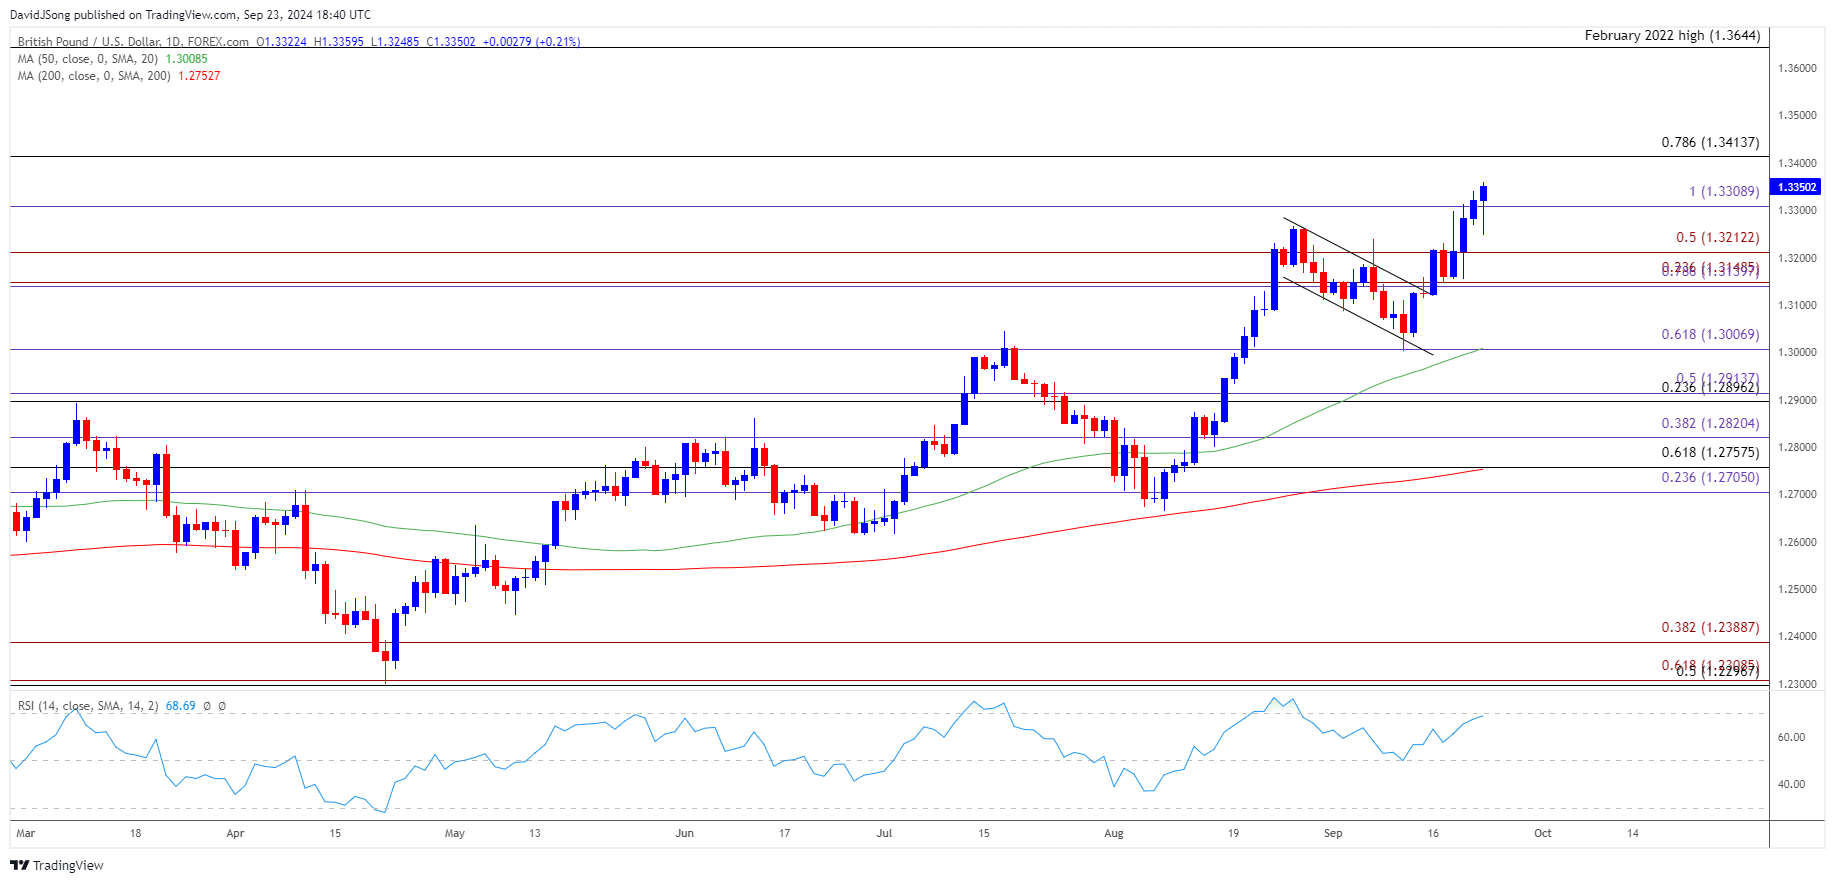
GBP/USD trades to a fresh yearly high (1.3360) as Federal Reserve officials endorse a dovish forward guidance for monetary policy, and a move above 70 in the Relative Strength Index (RSI) is likely to be accompanied by a further advance in the exchange rate like the price action from last month.
GBP/USD Rally Persists as Fed Endorses Dovish Forward Guidance
GBP/USD stages a four-day rally as Chicago Fed President Austan Goolsbee, who serves as an alternate voting-member on the Federal Open Market Committee (FOMC) in 2024, anticipates ‘many more rate cuts over the next year’ as inflation falls toward the central bank’s 2% target.
Goolsbee insists that ‘if we want a soft landing, we can't be behind the curve,’ with the official going onto say that ‘rates need to come down significantly going forward’ while speaking at the National Association of State Treasurers (NAST) Annual Conference.
With that said, the US Dollar may face headwinds ahead of the next FOMC rate decision on November 7 as the central bank prepares to further unwind its restrictive policy, but GBP/USD may face a near-term pullback if the RSI struggles to push into overbought territory
GBP/USD Price Chart –Daily

Chart Prepared by David Song, Strategist; GBP/USD on TradingView
- Keep in mind, GBP/USD bounced back ahead of the 50-Day SMA (1.3008) to breakout of the bull-flag formation from earlier this month, and the exchange rate may continue to trade to fresh yearly highs as it seems to be tracking the positive slope in the moving average.
- Need a break/close above 1.3410 (78.6% Fibonacci retracement) to open up the February 2022 high (1.3644), and the Relative Strength Index (RSI) may show the bullish momentum gathering pace should it climb above 70 to mirror the price action from last month.
- However, lack of momentum to hold above 1.3310 (100% Fibonacci extension) may keep the RSI out of overbought territory, with a move below 1.3210 (50% Fibonacci extension) bringing the 1.3140 (78.6% Fibonacci extension) to 1.3150 (23.6% Fibonacci extension) region on the radar.
--- Written by David Song, Strategist


