The Bank of Japan held their interest rate at 0.25% as widely expected, and there is little expectation for them to fire up their hawkish engines by any meaningful degree soon. The Bank of England also meets shortly and is also likely to hold their interest rate, at a much higher 4.75%. And recent data makes it unlikely that they will deliver a notably dovish tone for next year’s policy. And that could play nicely with a potential long setup on GBP/JPY.
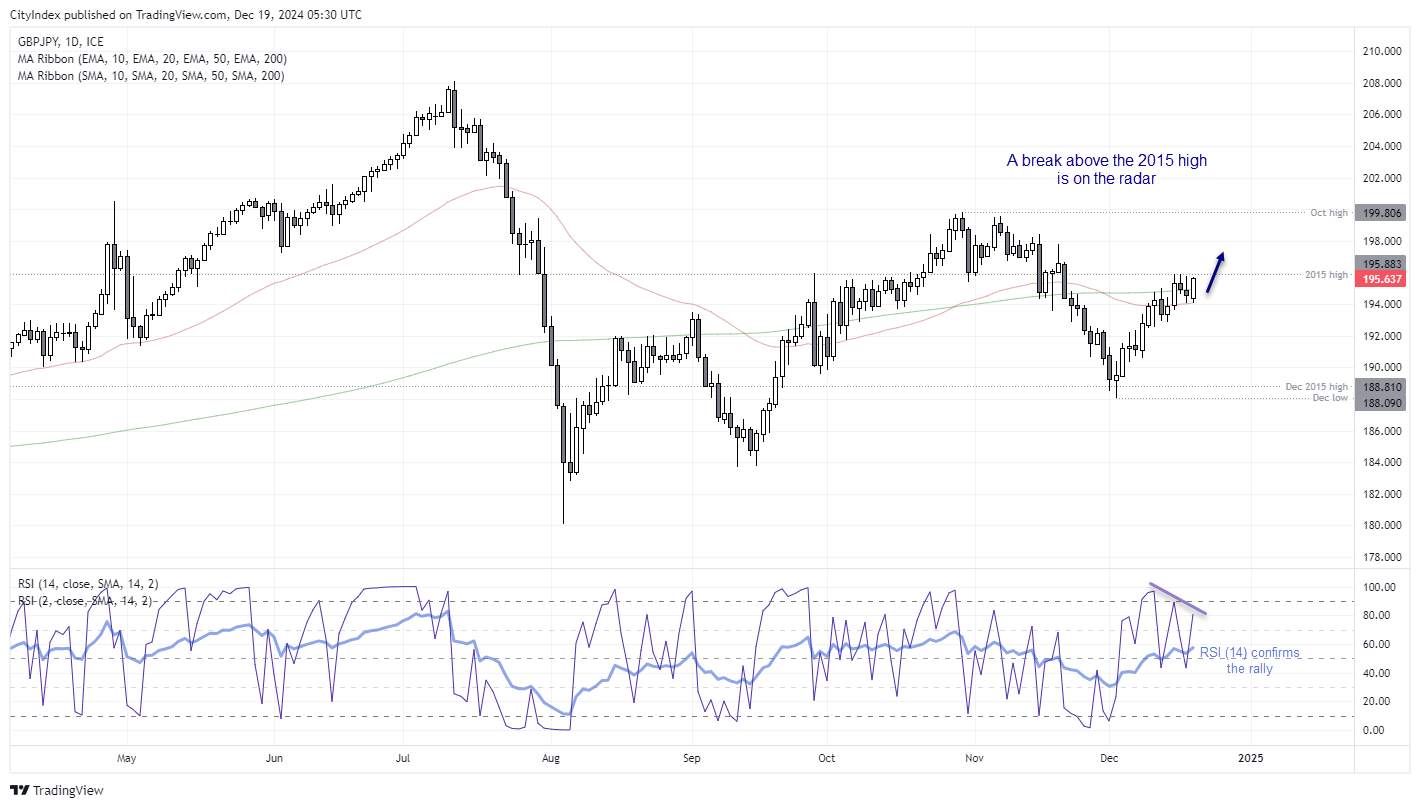
GBP/JPY daily chart:
A nice bullish rally has emerged from the December low, although it has stalled at the 2015 high once more. It provided resistance back in September ahead of an ascending triangle breakout, but this time only a mild two-day pullback has been seen. The cross found support at the 50-day EMA on Wednesday, and today’s low used it as a springboard to now trade above Monday’s close.
Given the daily RSI (14) is confirming the move higher, a bullish break above the 2015 high is now favoured. While there is a bearish divergence on the daily RSI (2), it is not overbought, and a break higher could also see the RSI break its own divergence.

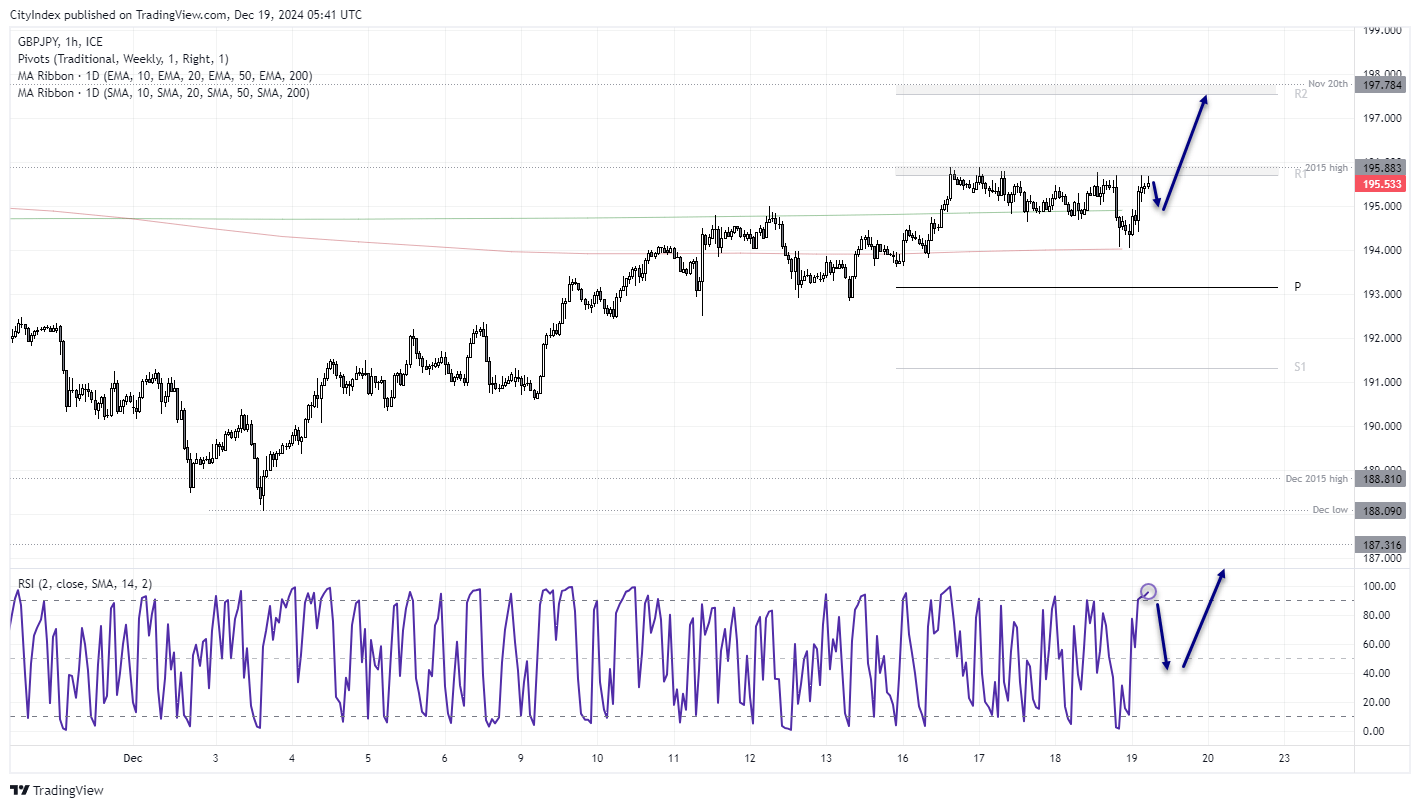
GBP/JPY 1-hour chart:
The hourly chart shows that the weekly R1 pivot has capped as resistance alongside the 2015 high. And while we saw a sudden selloff from those highs on Wednesday, support has since been found at the 50-day EMA with two bullish hammers.
With the RSI (2) overbought, bulls could wait for dips within today’s range, to say the 195 handle near the 200-day EMA. The bias remains bullish while prices remain above the 50-day EMA / 194 handle.
A break above the 2015 high assumes bullish continuation, with the 197 handle, weekly R2 pivot (197.55) and Nov 20th high comes into focus, just below 198.

How to trade with FOREX.com
Follow these easy steps to start trading with FOREX.com today:
- Open a Forex.com account, or log in if you’re already a customer.
- Search for the pair you want to trade in our award-winning platform.
- Choose your position and size, and your stop and limit levels.
- Place the trade.


