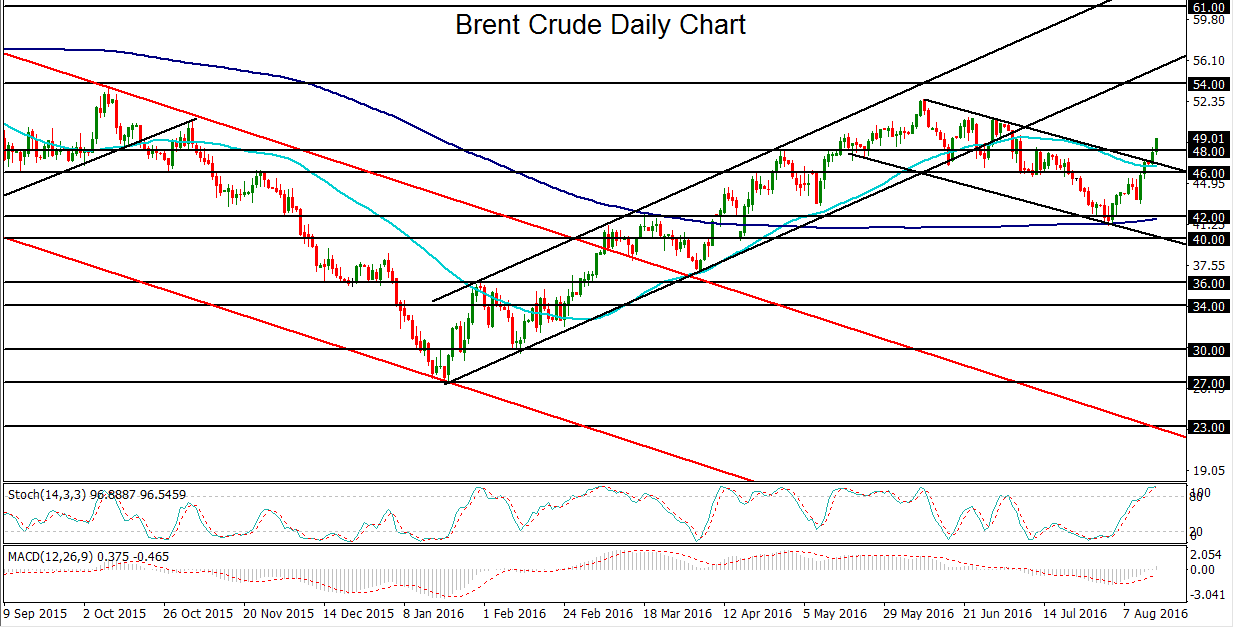
Crude oil prices, including both the US West Texas Intermediate and international Brent crude benchmarks, continued to surge sharply on Tuesday, extending the recent two-week rebound and recovery. In the process of this rise, prices have also broken out further above the short-term downtrend that had been in place for more than two months, since the early June highs.
The continued recovery in crude oil has been partly driven by speculation that major oil producers may finally begin to cooperate to help support crude prices, especially after recent comments by the Saudi energy minister alluded to this possible intention. Also, production declines and disruptions have become relatively widespread, including in countries such as Venezuela, Nigeria, and the United States. Additionally, the International Energy Agency projected last week that crude oil markets would see a rebalancing within the next several months, with global oil inventories finally seeing a draw towards the end of the year.
In the case of Brent crude oil, these bullish catalysts have helped to push price above several major resistance factors, including the key 46.00 level, the important 50-day moving average, and a parallel downtrend channel that has defined the noted two-month downtrend since the June highs above 52.00.
On Tuesday, Brent crude surged well above the key 48.00 prior resistance level. A major immediate risk factor for the current bullish recovery will come on Wednesday, when the US Energy Information Administration will release its weekly data on US crude oil inventories. The past several weeks of data have shown rather disappointing inventory builds against expected draws. For last week, the forecast is for a relatively modest build of around 300,000 barrels. Any substantial departure from expectations on Wednesday could prompt a significant move in crude oil prices.
Currently continuing to trade well above 48.00, Brent crude lies at a critical juncture. Continued upside momentum above 48.00 could open the way towards June’s noted 52.50-area highs, with a further upside objective at the 54.00 resistance level. Any break back down below 48.00 and back into the parallel downtrend channel would clearly be a bearish signal, in which case the two-month downtrend could resume, with key downside support around the 42.00 level and 200-day moving average.

Latest market news
Today 05:30 PM
Today 04:41 PM
Today 04:30 PM
Today 02:15 PM
Today 02:07 PM


