When the value of the US Dollar moves higher, many assume that the value of Gold should move lower. And most of the time, that is often the case. However, the correlations aren’t always a perfect 1-for-1. Therefore, traders should look at the relationship of gold to the US Dollar over time, and not on a short-term basis.
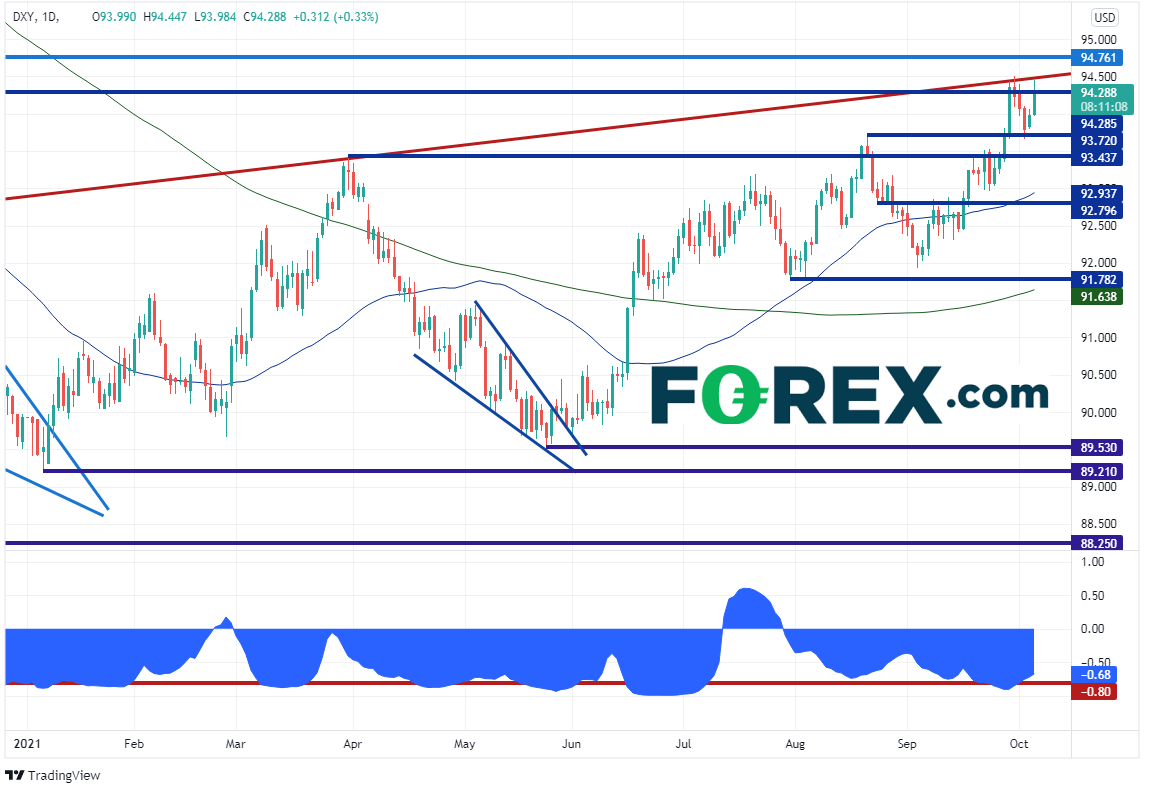
In the chart of the US Dollar Index (DXY) below, price is making new local highs and testing a long-term trendline dating back to 2011 (red). Notice the correlation coefficient at the bottom of the chart. Since the start of the year, there has been a negative correlation most of the time, however there was a brief period in February and during July where the relationship was positive. Also notice that the relationship isn’t always at extremes. Traders typically look for correlation coefficients above +0.80 or below -0.80 for a strong correlation. This will help to make better trading decisions. The correlation was -0.90 at the end of September, however it is currently at -0.68. It is still inversely related but not at an extreme.

Source: Tradingview, Stone X
Everything you need to know about the US Dollar Index
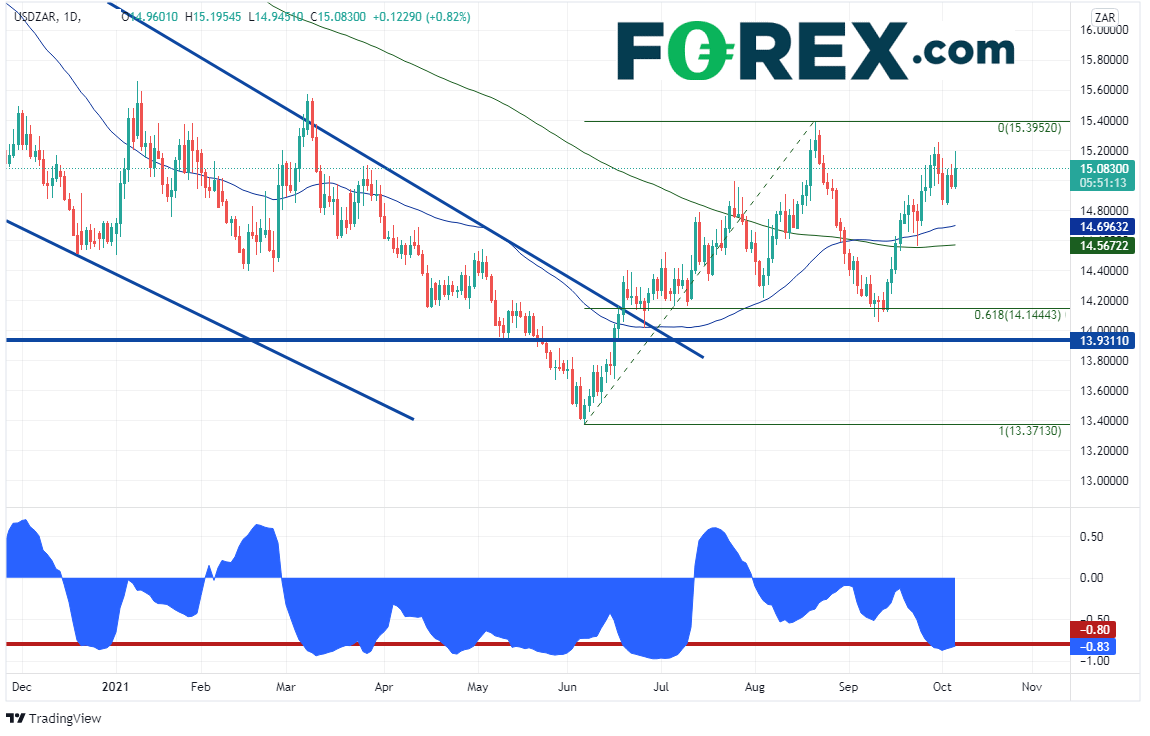
However, just because Gold’s correlation isn’t always at an extreme vs the DXY doesn’t mean there aren’t correlations to other US Dollar pairs traders can look for. The South African Rand is often correlated with Gold (or inversely correlated to USD/ZAR) , as South Africa is a large exporter of Gold. The current correlation coefficient between Gold and USD/ZAR is -0.83 on the daily timeframe. Therefore, traders can use the price of Gold to help make trading decisions regarding USD/ZAR.

Source: Tradingview, Stone X
Trade USD/ZAR now: Login or open a new account!
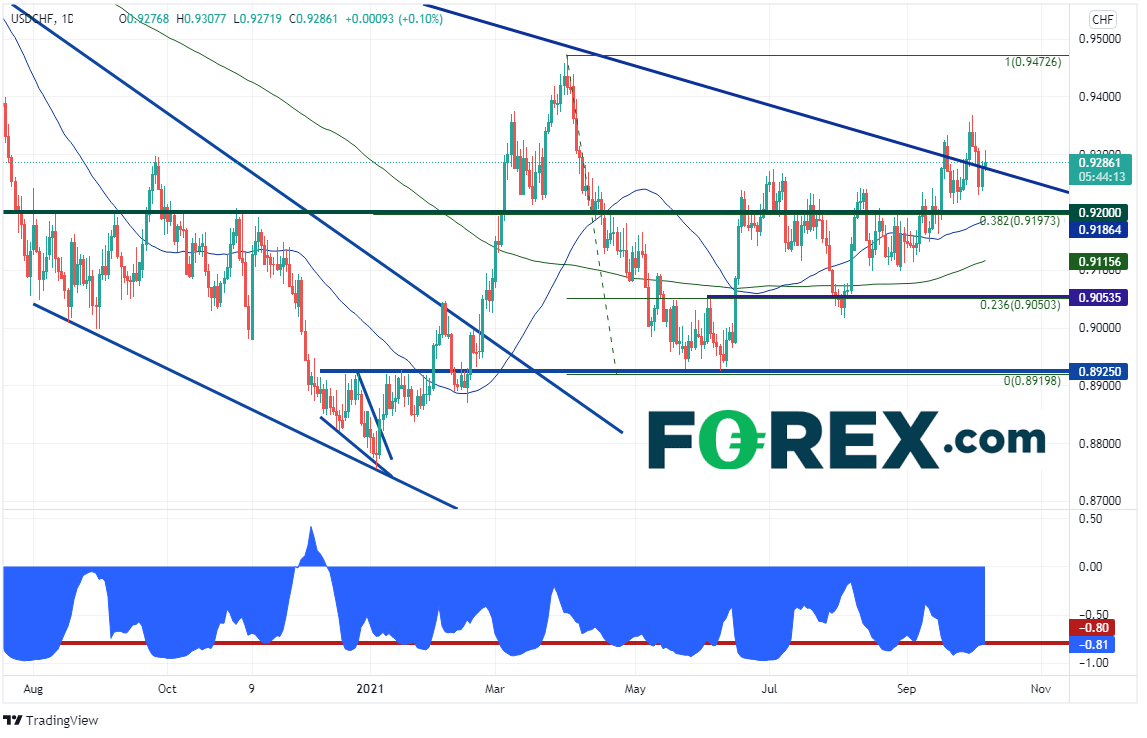
USD/CHF is often used a as proxy for currency traders who don’t have access to trade the DXY. Notice at the bottom of the screen that the correlation coefficient is -0.81. The correlation has been negative since the beginning of the year and is currently at an extreme (below -0.80). Therefore, traders can look to use Gold to help determine the direction of USD/CHF.

Source: Tradingview, Stone X
Trade USD/CHF now: Login or open a new account!
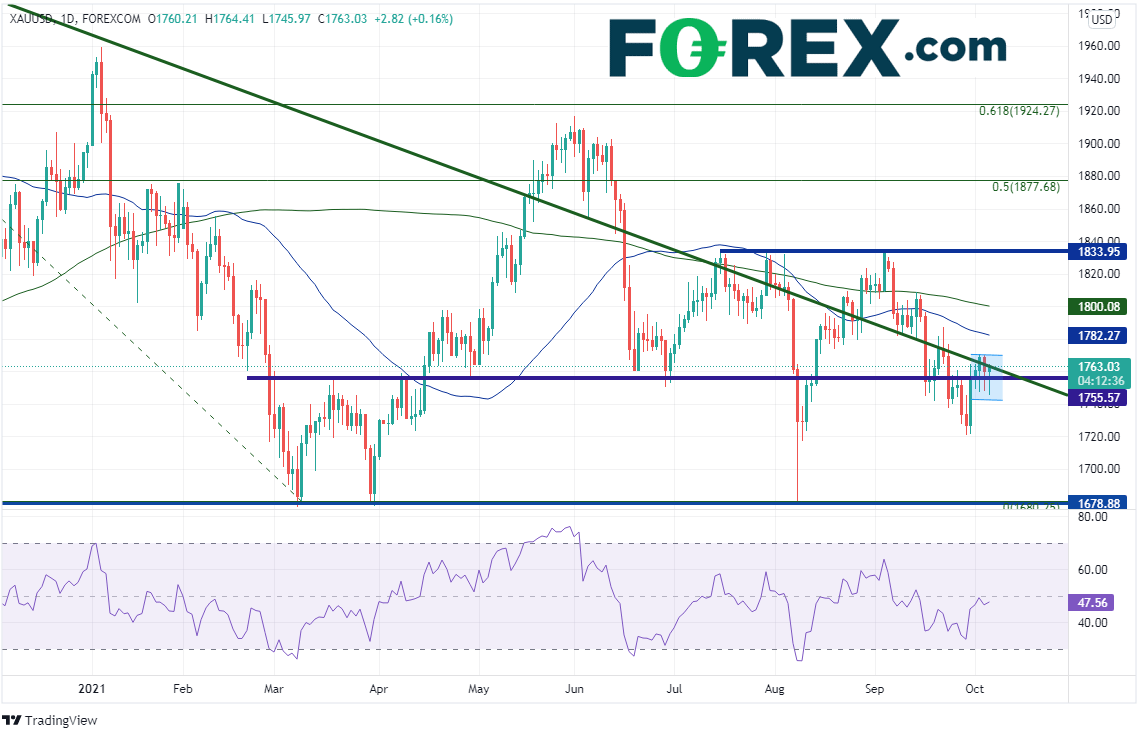
On a daily timeframe, Gold (XAU/USD) has been putting in lower highs since making all-time highs in August 2020. Since mid-May, Gold has been oscillating around the downward sloping trendline (green) from those highs at 2075.11. Notice that the last 4 daily candlesticks have long lower wicks. This implies that sellers come in early in the day and buyers scoop Gold off the lows to push it higher into the close. If buyers can push price above the 50- and 200- Day Moving Averages, at 1782.25 and 1800.08 respectively, there is room for Gold to move up to horizontal resistance at 1834. If this happens, watch for USD/CHF to make it’s was back to 0.9200 and USD/ZAR to test recent lows near 14.10.

Source: Tradingview, Stone X
However, if Gold fails to move higher and bears gain control, price can head towards the lows of August 9th at 1679.13. This could push USD/CHF towards April 1st highs at 0.9473 and USD/ZAR towards 15.3950.
The US Dollar Index (DXY) and Gold (XAU/USD) are usually inversely correlated, that is, the two assets move in opposite directions. However, most of the time, the correlation isn’t strong enough to be meaningful. But if traders look for correlations between Gold and other US Dollar pairs which are above +0.80 or below -0.80, they’ll have a better chance of using the precious metal to help trade the US Dollar.
Learn more about gold and silver trading opportunities


