USD/JPY Outlook
USD/JPY carves a series of higher highs and lows as it extends the rebound from last week’s low (133.75), and data prints coming out of the US may keep the exchange rate afloat as the Retail Sales report is anticipated to show a rebound in household spending.
USD/JPY Reverses Ahead of Monthly Low to Eye 200-Day SMA
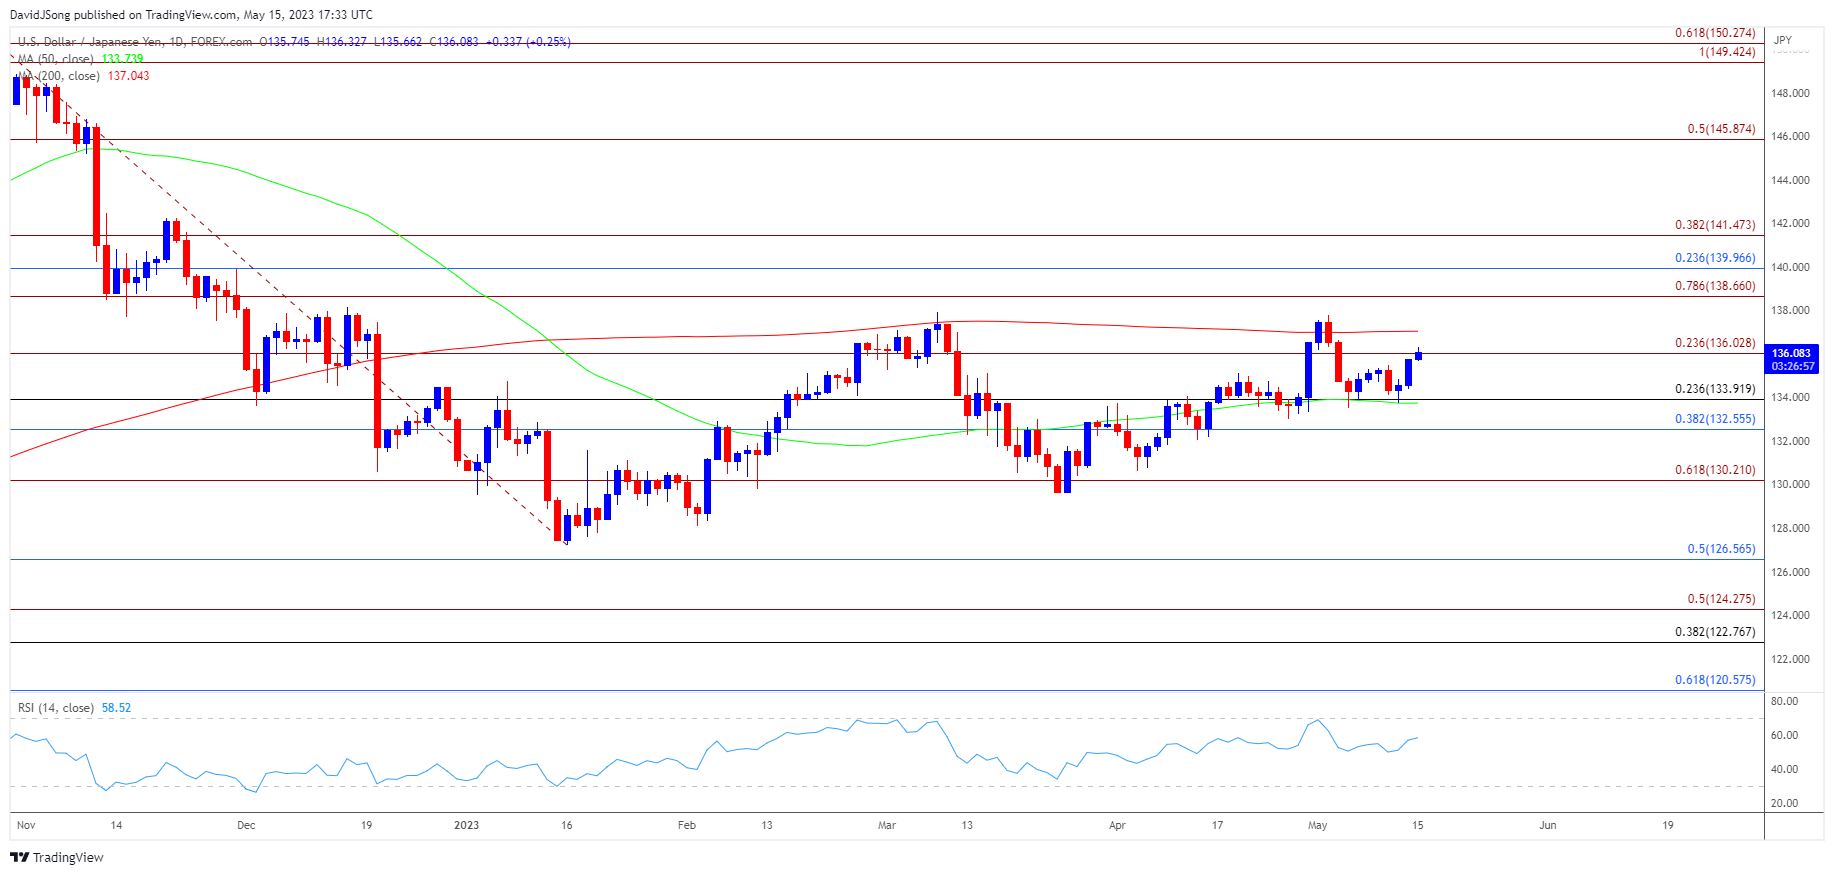
USD/JPY approaches the 200-Day SMA (137.04) after bouncing back ahead of the monthly low (133.50), and the exchange rate may attempt to test the monthly high (137.78) as it appears to be tracking the rise in US Treasury yields.
Join David Song for the Weekly Fundamental Market Outlook webinar. Register Here

At the same time, the update to the US Retail Sales report may sway USD/JPY as private sector spending is expected to increase 0.7% in April after contracting 0.6% the month prior, and little indiciations of a looming recession may push the Federal Reserve to further comabt inflation as the labor market remains tight.
In turn, Fed officials may tame speculation for lower interest rates in 2023 as Chairman Jerome Powell warns that ‘it would not be appropriate to cut rates’ if inflation remains persistent, and it remains to be seen if the Federal Open Market Committee (FOMC) will adjust the forward guidance at the next interest rate decision on June 14 as the central bank is slated to release the updated Summary of Economic Projections (SEP).
With that said, the diverging paths between the FOMC and Bank of Japan (BoJ) may keep USD/JPY afloat as Governor Kazuo Ueda and Co. seem to be in no rush to move away from Qualitative and Quantitative Easing (QQE) with Yield-Curve Control (YCC), but the exchange rate may continue to trade within the opening range for May if it struggles to trade back above the 200-Day SMA (137.04).
Japanese Yen Price Chart – USD/JPY Daily

Chart Prepared by David Song, Strategist; USD/JPY on TradingView
- USD/JPY bounces back head of the monthly low (133.50) to hold above the 50-Day SMA (133.74), with the exchange rate now approaching the 200-Day SMA (137.04) as it extends the series of higher highs and lows from last week.
- A move above the long-term moving average raises the scope for a test of the monthly high (137.78), with a break above the yearly high (137.91) opening up the 138.70 (78.6% Fibonacci extension) to 140.00 (23.6% Fibonacci retracement) region.
- However, failure to push above the long-term moving average may keep USD/JPY within the opening range for May, with a move below the 136.00 (23.6% Fibonacci extension) handle bringing the 132.60 (38.2% Fibonacci retracement) to 133.90 (23.6% Fibonacci retracement) area back on the radar.
Additional Resources:
USD/CAD recovery materializes amid failure to test April low
EUR/USD outlook clouded by downward trend in RSI
--- Written by David Song, Strategist
Follow me on Twitter at @DavidJSong


