USD/JPY Outlook
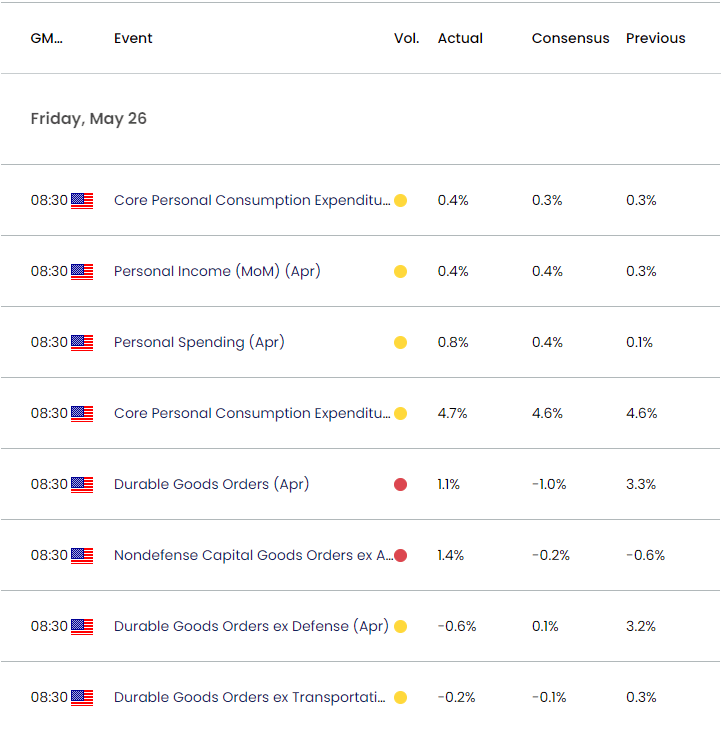
USD/JPY registers a fresh yearly high (140.73) following a batch of better-than-expected data out of the US, and the move above 70 in the Relative Strength Index (RSI) is likely to be accompanied by a further advance in the exchange rate like the price action from last year.
USD/JPY Forecast: RSI Flashes Overbought Signal for First Time in 2023
USD/JPY appears to be trading within an ascending channel following the failed attempt to test the monthly low (133.50), and growing speculation for another Federal Reserve rate hike may keep the exchange rate afloat as the Personal Consumption Expenditure (PCE) Price Index points to sticky inflation.
Join David Song for the Weekly Fundamental Market Outlook webinar. Register Here

The unexpected uptick in the core PCE, the Fed’s preferred gauge for inflation, along with the rise 1.1% rise in US Durable Goods Orders may push the Federal Open Market Committee (FOMC) to further embark on its hiking-cycle, and it remains to be seen if Chairman Jerome Powell and Co. will project higher trajectory for US interest rates as the central bank is slated to update the Summary of Economic Projections (SEP) at its next meeting in June.

Source: CME
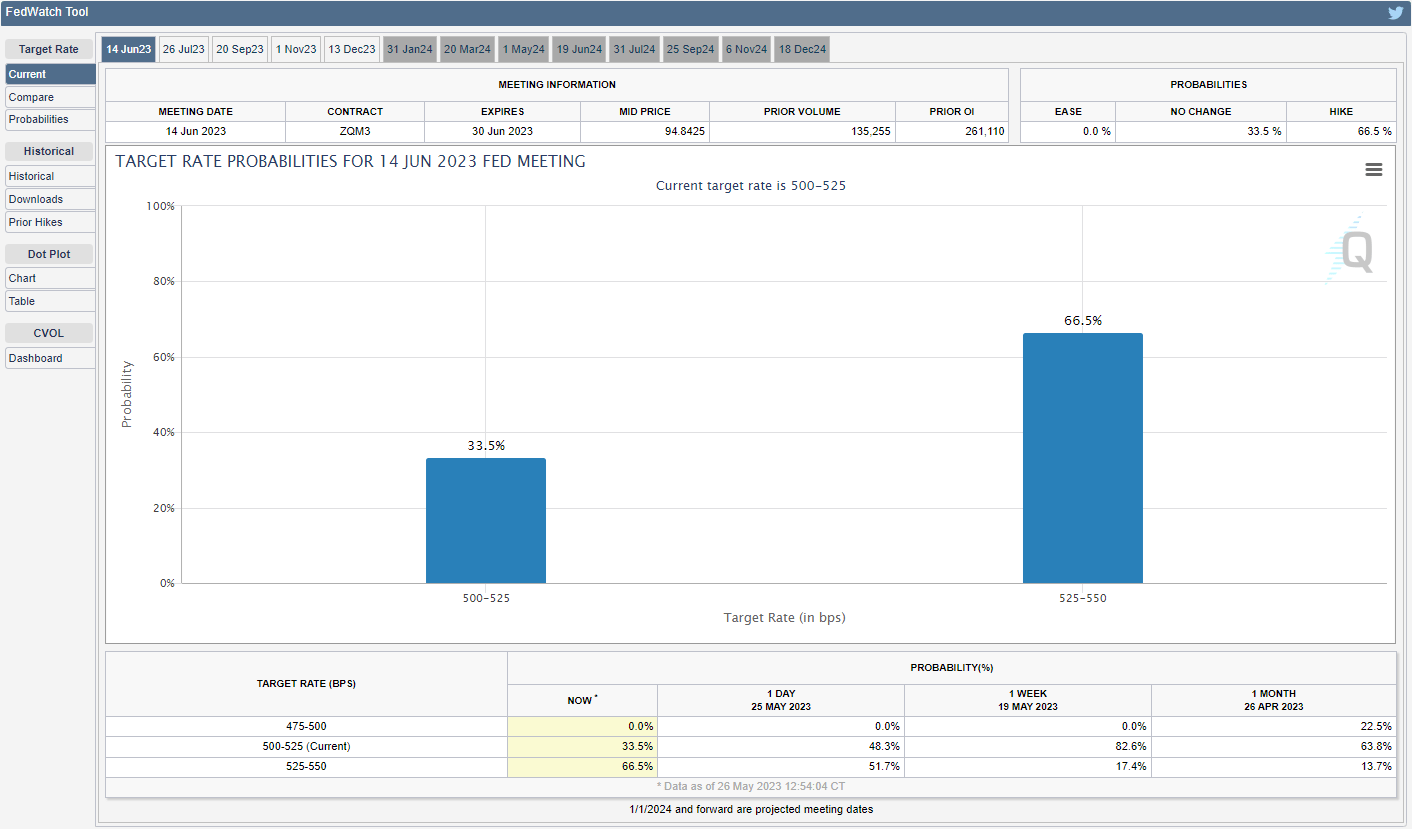
Until then, speculation surrounding Fed policy may sway USD/JPY as the CME FedWatch Tool now reflects a greater than 60% probability for another 25bp rate hike, and growing expectations for higher US interest rates may lead to a further appreciation in the exchange rate as the Bank of Japan (BoJ) sticks to Quantitative and Qualitative Easing (QQE) with Yield-Curve Control (YCC).
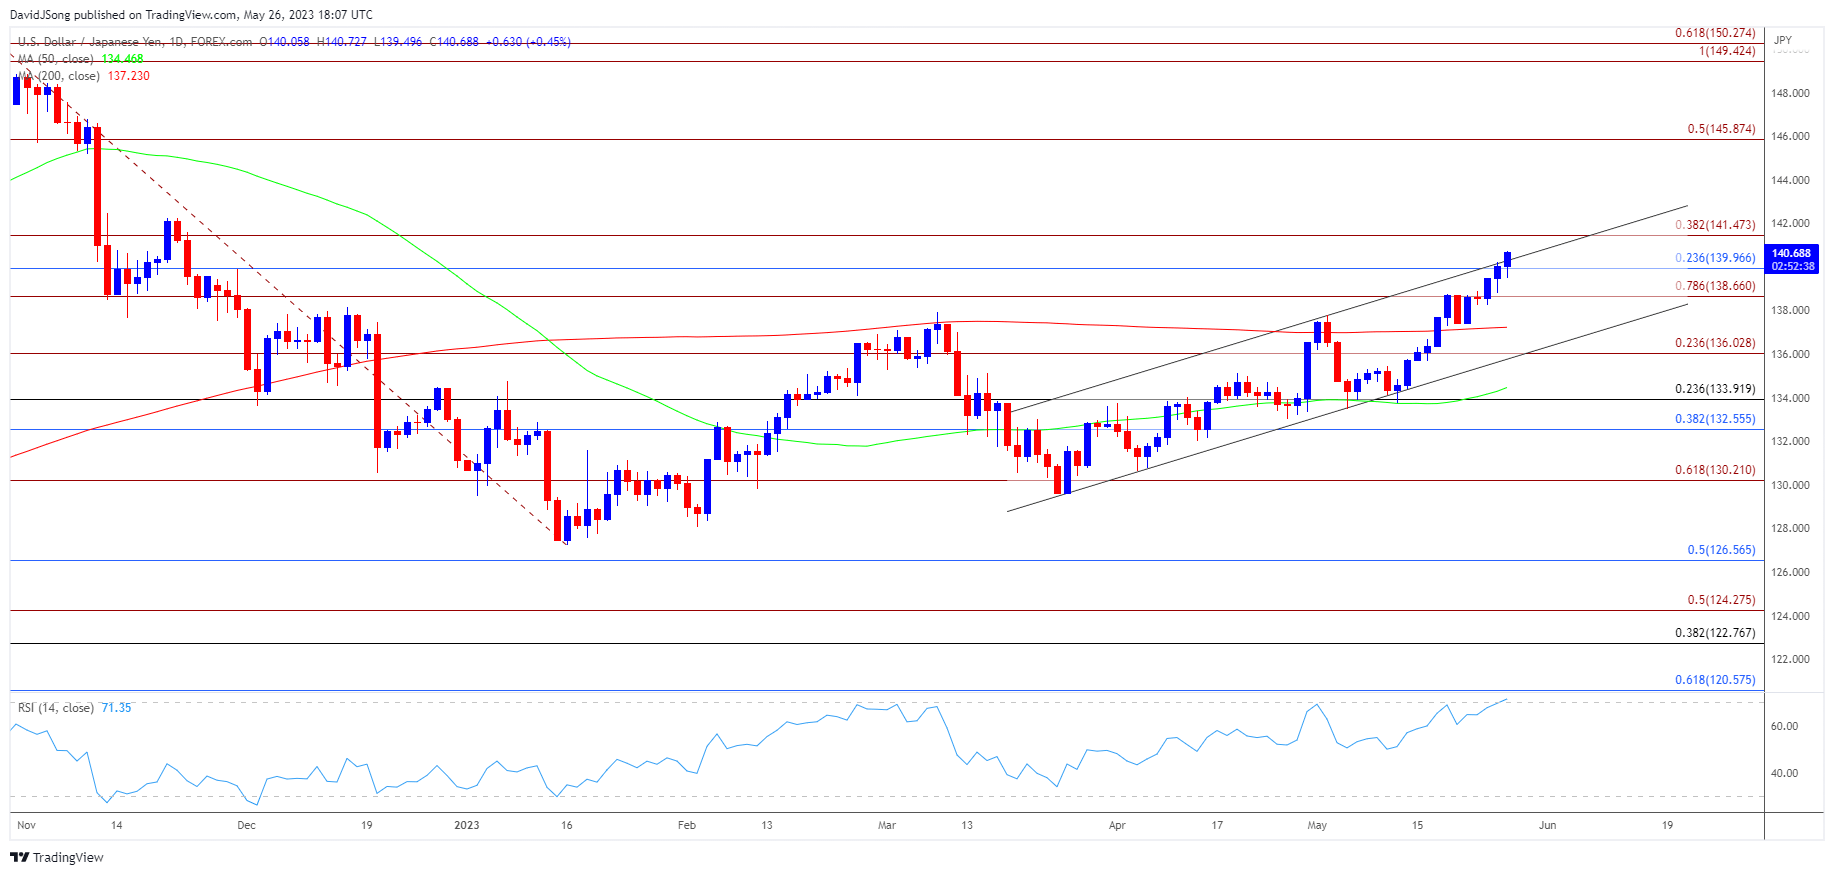
With that said, the move above 70 in the Relative Strength Index (RSI) is likely to be accompanied by a further advance in USD/JPY like the price action from last year, and the exchange rate may continue to carve a series of higher highs and lows over the coming days as it appears to be breaking above channel resistance.
Japanese Yen Price Chart – USD/JPY Daily

Chart Prepared by David Song, Strategist; USD/JPY on TradingView
- USD/JPY appears to be trading within an ascending channel following the failed attempt to test the monthly low (133.50), with the recent advance in the exchange rate pushing the Relative Strength Index (RSI) into overbought territory for the first time this year.
- The move above 70 in the RSI is likely to be accompanied by a further rise in USD/JPY like the price action from last year, with the break above channel resistance raising the scope for a move towards 141.50 (38.2% Fibonacci extension).
- Next area of interest comes in around the November 2022 high (148.83), but failure to extend the recent series of higher highs and lows may lead to a near-term pullback in USD/JPY, with a move below the 138.70 (78.6% Fibonacci extension) to 140.00 (23.6% Fibonacci retracement) region bringing the 200-Day SMA (137.23) back on the radar.
Additional Resources:
AUD/USD Breaches March Low to Bring November Low on Radar
USD/CAD Rate Climbs Above 50-Day SMA to Eye Monthly High
--- Written by David Song, Strategist
Follow me on Twitter at @DavidJSong


