US Dollar Outlook: USD/JPY
USD/JPY pulls back ahead of the weekly high (153.88) as the US Job Openings and Labor Turnover Survey (JOLTS) warns of a weakening labor market, but the Relative Strength Index (RSI) may show the bullish momentum gathering pace as it continues to flirt with overbought territory.
USD/JPY Forecast: RSI Continues to Flirt with Overbought Zone
USD/JPY struggles to extend the recent series of higher highs and lows as the gauge for US job openings narrows to 7.443M in September from a revised 7.861M the month prior to mark the lowest reading since January 2021.
Join David Song for the Weekly Fundamental Market Outlook webinar. David provides a market overview and takes questions in real-time. Register Here
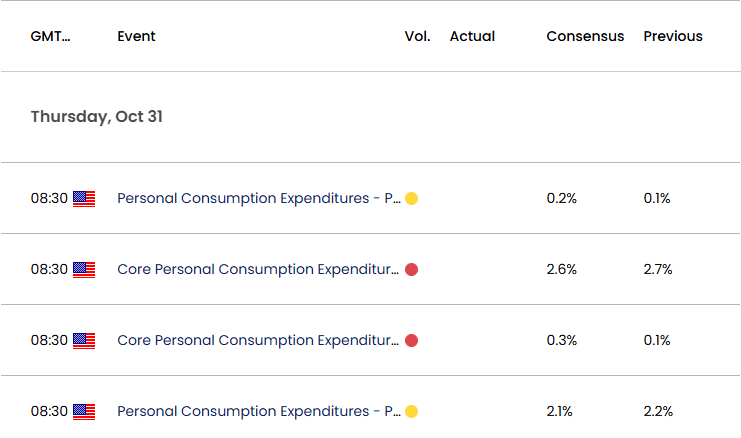
The development may keep the Federal Reserve on track to further unwind its restrictive policy as ‘reducing restraint too slowly could unduly weaken economic activity and employment,’ and the update to the Personal Consumption Expenditure (PCE) Price Index, the Fed’s preferred gauge for inflation, may also influence USD/JPY as both the headline and core rate are seen narrowing in September.
US Economic Calendar

Additional evidence of slowing price growth may drag on the US Dollar as it encourages the Federal Open Market Committee (FOMC) to achieve a neutral stance sooner rather than later, but a higher-than-expected PCE print may keep USD/JPY afloat as it curbs speculation for another 50bp rate cut.
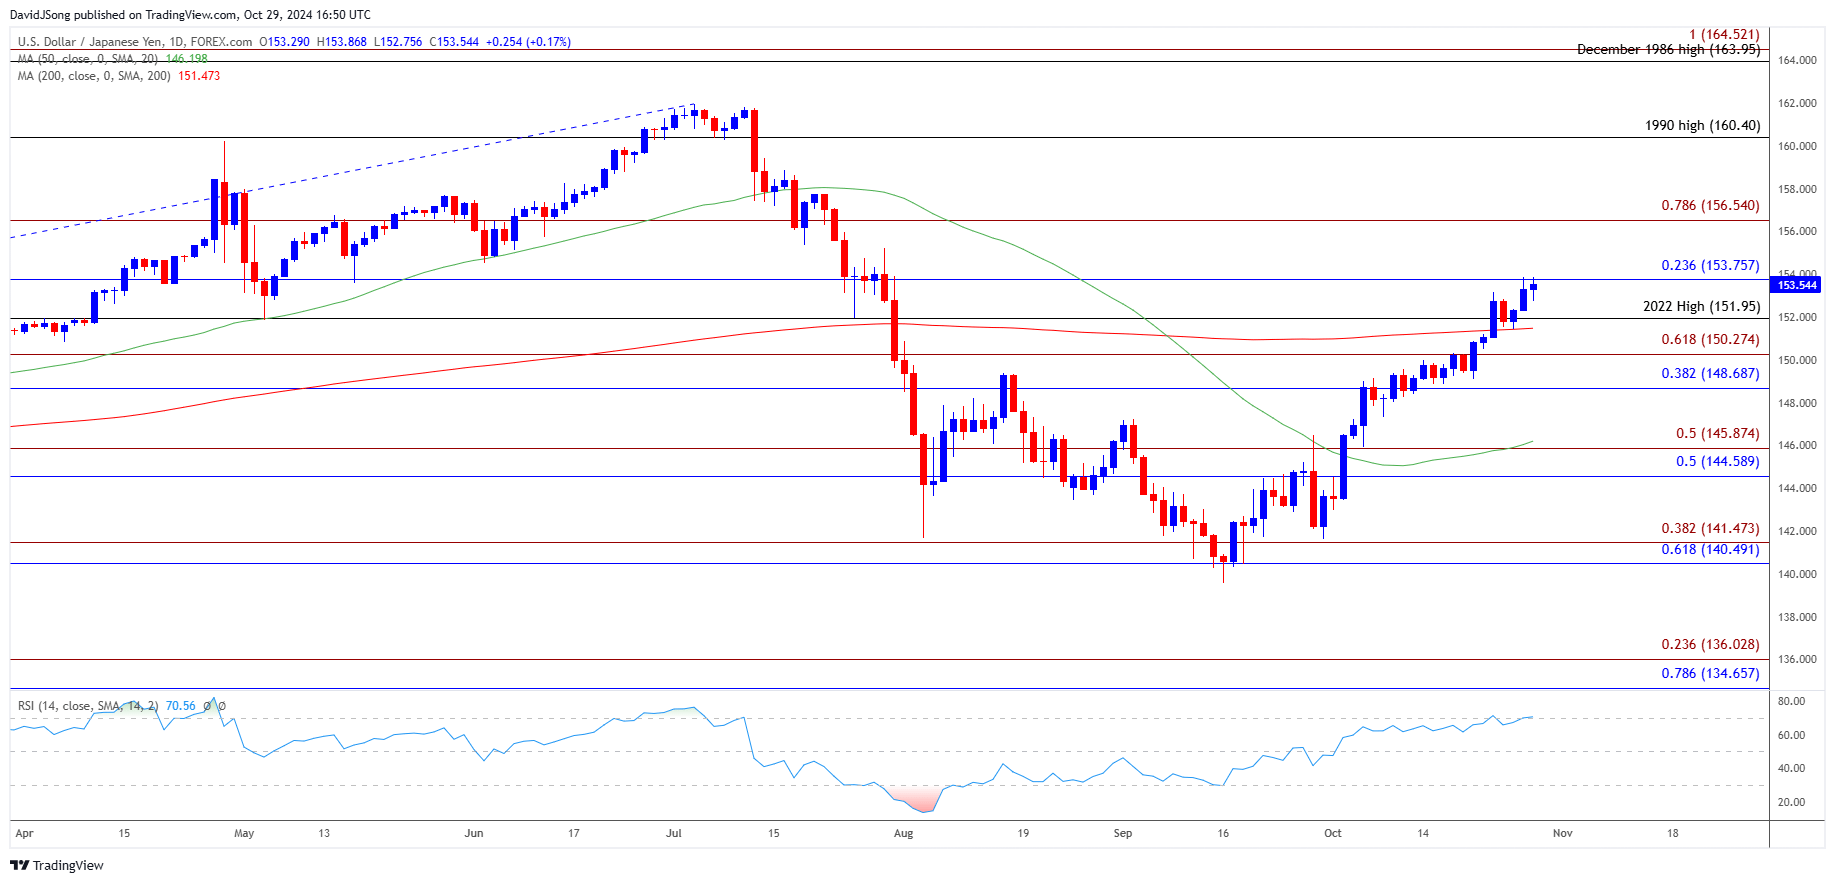
With that said, a further advance in USD/JPY may push the RSI above 70 as it holds around its highest level since July, but lack of momentum to extend the recent series of higher highs and lows in the exchange rate may keep the oscillator out of overbought territory.
USD/JPY Price Chart – Daily

Chart Prepared by David Song, Strategist; USD/JPY on TradingView
- USD/JPY trades near the weekly high (153.88) as it stages a three-day rally, with a close above 153.80 (23.6% Fibonacci retracement) bringing 156.50 (78.6% Fibonacci extension) on the radar.
- Next area of interest comes in around the 1990 high (160.40) but another failed attempt to close above 153.80 (23.6% Fibonacci retracement) may push USD/JPY back towards the 148.70 (38.2% Fibonacci retracement) to 150.30 (61.8% Fibonacci extension) zone.
- A break/close below the 144.60 (50% Fibonacci retracement) to 145.90 (50% Fibonacci extension) region opens up the monthly low (142.97), with the next area of interest coming in around 140.50 (61.8% Fibonacci retracement) to 141.50 (38.2% Fibonacci extension).
Additional Market Outlooks
Monetary vs Fiscal Policy: Implications for FX Markets
USD/CAD Eyes August High as RSI Holds in Overbought Territory
AUD/USD Vulnerable amid Failure to Defend September Low
Gold Price Forecast: RSI Falls Back from Overbought Zone
--- Written by David Song, Senior Strategist
Follow on Twitter at @DavidJSong


