USD/CAD Outlook
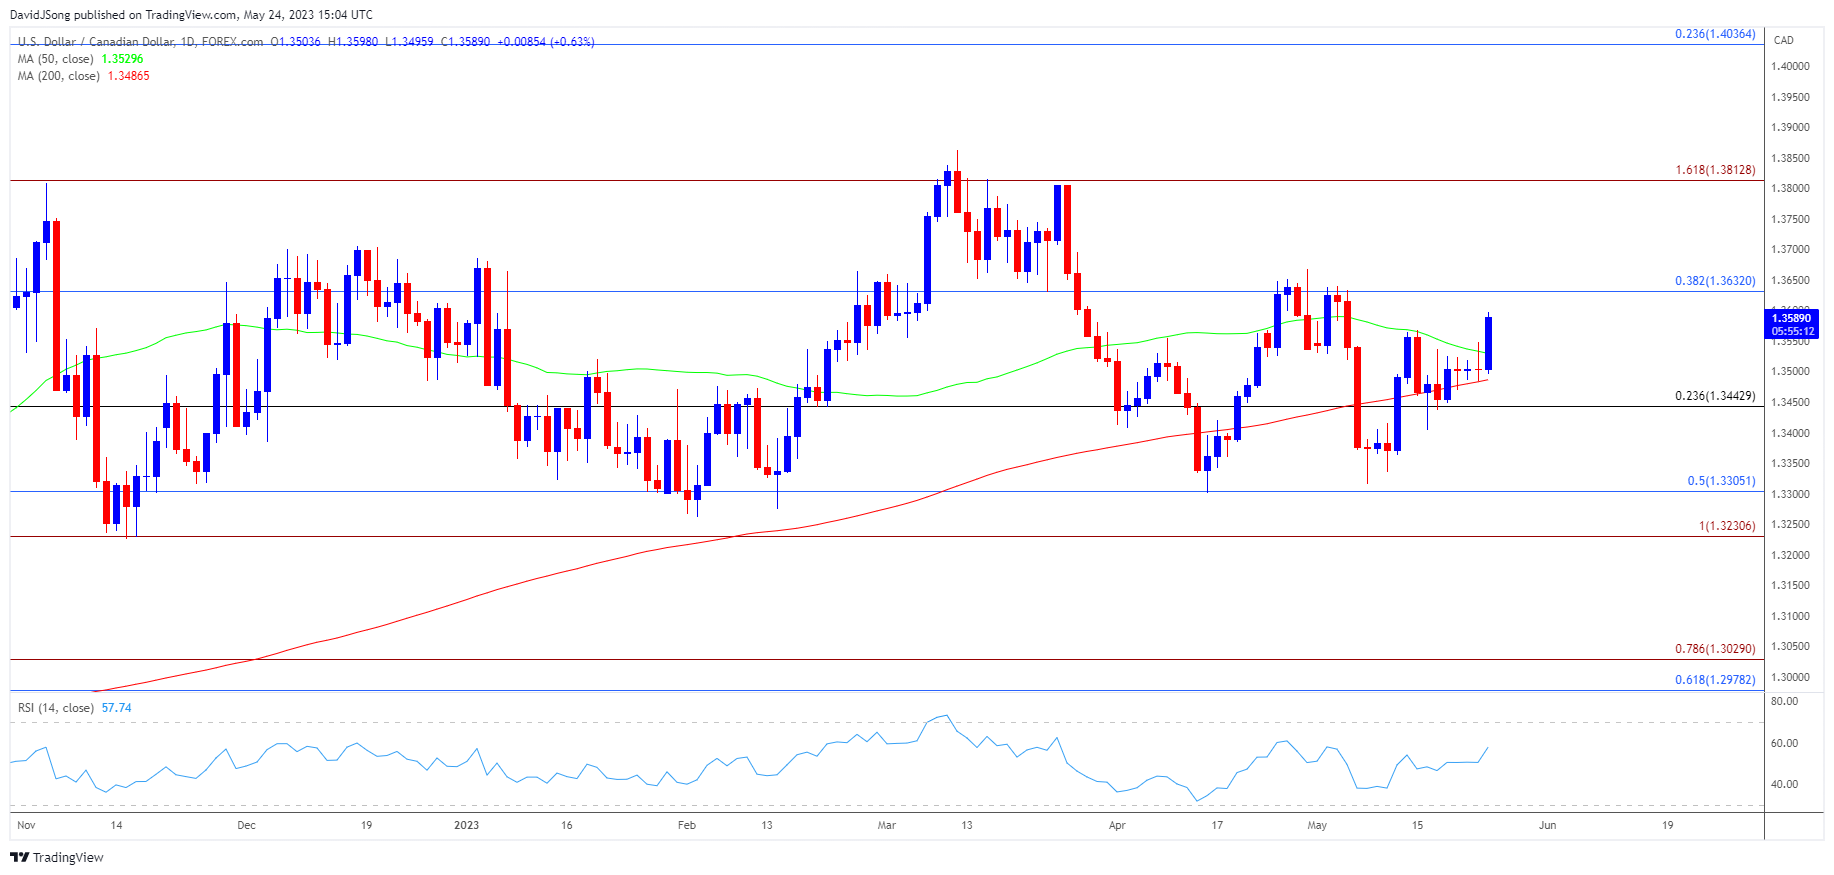
USD/CAD trades to a fresh weekly high (1.3598) as it breaks out of a narrow range, and the exchange rate may continue to retrace the decline from the monthly high (1.3640) as it climbs back above the 50-Day SMA (1.3529).
USD/CAD Rate Climbs Above 50-Day SMA to Eye Monthly High
USD/CAD seems to be tracking the yearly range amid the failed attempt to test the April low (1.3301), but data prints coming out of the US may generate increased volatility in the exchange rate amid hints of stagflation.
Join David Song for the Weekly Fundamental Market Outlook webinar. Register Here

The core Personal Consumption Expenditure (PCE) Price Index, the Federal Reserve’s preferred gauge for inflation, is anticipated to hold steady at 4.6% per annum in April, while US Durable Goods Orders are expected to contract 1.0% during the same period following the 3.2% expansion in March.
Evidence of persistent price growth along withs signs of a slowing economy may cloud the US monetary policy outlook as the Federal Open Market Committee (FOMC) acknowledges that ‘reducing inflation is likely to require a period of below-trend growth,’ and it remains to be seen if Chairman Jerome Powell and Co. will take further steps to combat inflation as the central bank is slated to release the updated Summary of Economic Projections (SEP) at the next interest rate decision on June 14.

Source: CME
Until then, developments coming out of the US may sway foreign exchange markets as the CME FedWatch Tool now reflects a 30% probability for another 25bp Fed rate hike, and growing speculation for higher interest rates may keep USD/CAD afloat especially as the Bank of Canada (BoC) looks poised to retain a wait-and-see approach in managing monetary policy.
With that said, USD/CAD may continue to track the yearly range amid the failed attempt to test the April low (1.3301), and the exchange rate may attempt to retrace the decline from the monthly high (1.3640) as it trades back above the 50-Day SMA (1.3529).
Canadian Dollar Price Chart – USD/CAD Daily

Chart Prepared by David Song, Strategist; USD/CAD Price on TradingView
- USD/CAD reversed ahead of the April low (1.3301) to trade back above the 50-Day SMA (1.3529), with the exchange rate breaking out of the range bound price action carried over from last week as it trades to a fresh weekly high (1.3597).
- A breach above the monthly high (1.3640) along with a close above 1.3630 (38.2% Fibonacci retracement) may lead to a test of the April high (1.3668), with the next area of interest coming in around 1.3810 (161.8% Fibonacci extension).
- However, USD/CAD may face a narrowing range if it struggles to break/close above 1.3630 (38.2% Fibonacci retracement), with a move below the moving average bringing the 1.3440 (23.6% Fibonacci retracement) area back on the radar.
Additional Resources:
Gold Price Forecast: Bullion Susceptible to Test of April Low
USD/JPY Rally Fizzles with RSI Reversing Ahead of Overbought Zone
--- Written by David Song, Strategist
Follow me on Twitter at @DavidJSong


