US Dollar Forecast: USD/CAD
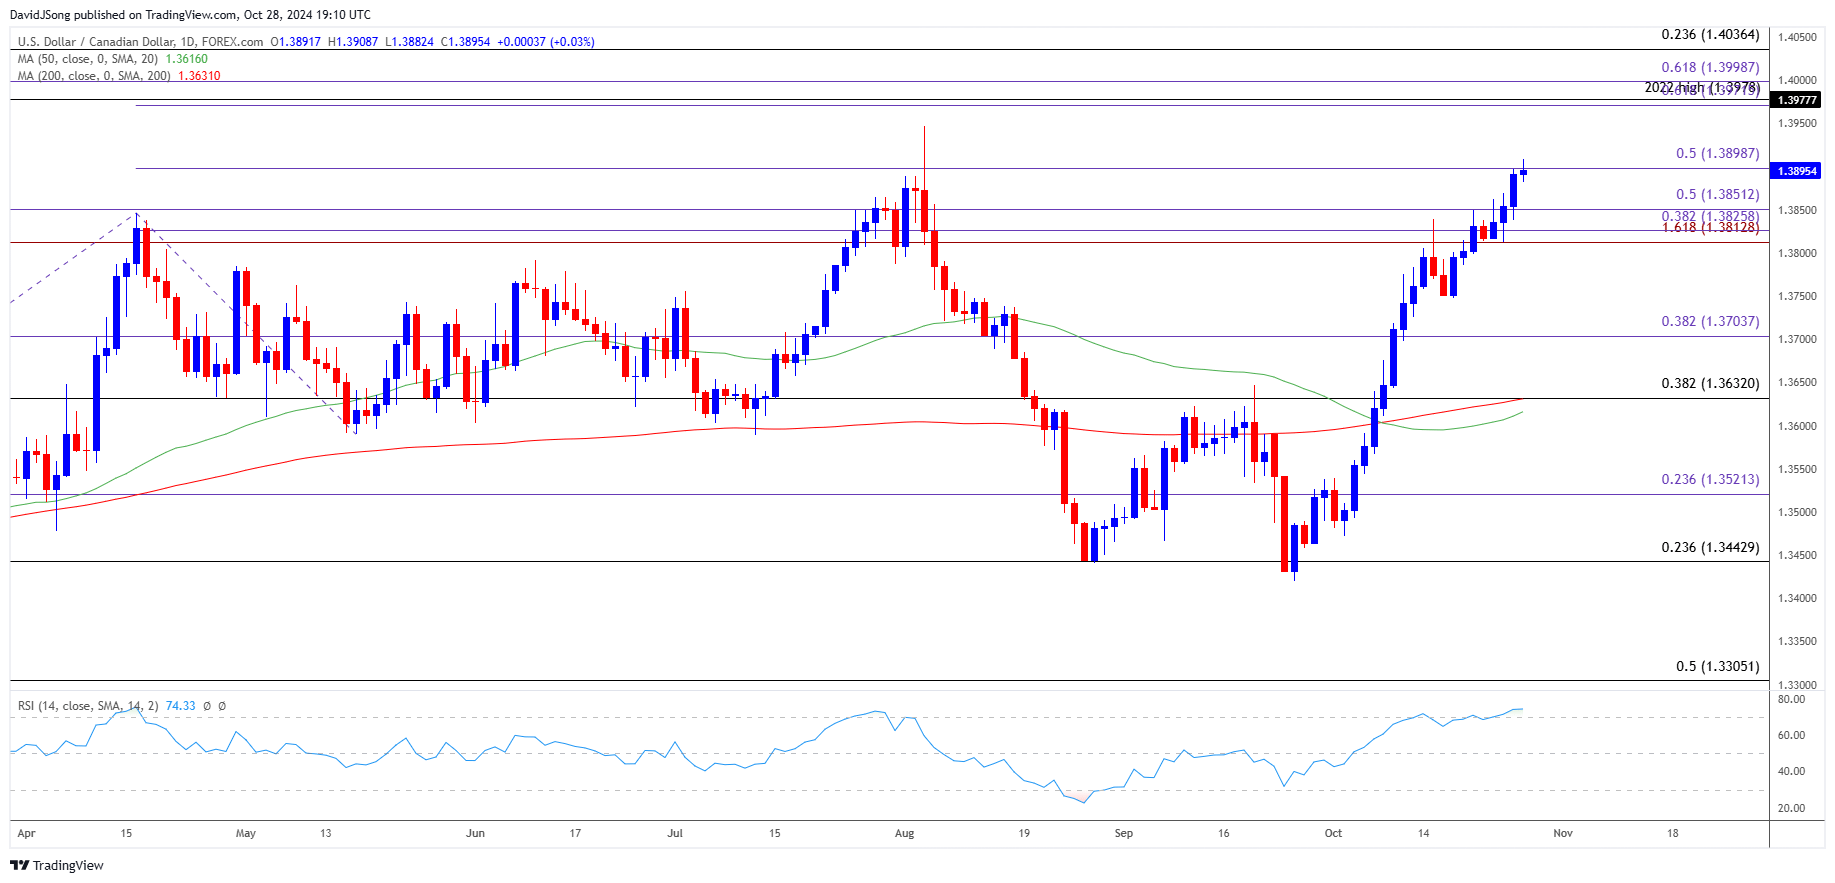
USD/CAD extends the series of higher highs and lows from last week to keep the Relative Strength Index (RSI) in overbought territory, but failure to test the August high (1.3947) may pull the oscillator back below 70.
USD/CAD Eyes August High as RSI Holds in Overbought Territory
USD/CAD continues to register fresh monthly highs after rallying for four consecutive weeks, and the exchange rate may extend the advance following the Bank of Canada rate cut as Governor Tiff Macklem and Co. ‘expect to reduce the policy rate further.’
Join David Song for the Weekly Fundamental Market Outlook webinar. David provides a market overview and takes questions in real-time. Register Here
US Economic Calendar

At the same time, the Federal Reserve may also implement lower interest rates as the central bank ‘projects that the appropriate level of the federal funds rate will be 4.4 percent at the end of this year,’ and the update to the Job Openings and Labor Turnover Survey (JOLTS) may encourage the Fed to pursue a rate-cutting cycle as the gauge for job openings is expected to narrow to 7.99M in September from 8.04M the month prior.
With that said, signs of a weakening US labor market may curb the recent advance in USD/CAD as it fuels speculation for another 50bp Fed rate cut, but a better-than-expected JOLTS report may generate a test of the August high (1.3947) as it puts pressure on the Federal Open Market Committee (FOMC) to gradually unwind its restrictive policy.
USD/CAD Price Chart – Daily

Chart Prepared by David Song, Strategist; USD/CAD Price on TradingView
- USD/CAD climbs to a fresh monthly high (1.3909) as it stages a four-day rally, with a close above 1.3900 (50% Fibonacci extension) raising the scope for a test of the August high (1.3947).
- Need a break/close above the 1.3970 (61.8% Fibonacci extension) to 1.4000 (61.8% Fibonacci extension) region to open up 1.4040 (23.6% Fibonacci retracement) but lack of momentum to close above 1.3900 (50% Fibonacci extension) may curb the bullish prices series in USD/CAD.
- Need a breach below the 1.3810 (161.8% Fibonacci extension) to 1.3850 (50% Fibonacci extension) zone to bring 1.3700 (38.2% Fibonacci extension) back on the radar, with the next area of interest coming in around 1.3630 (38.2% Fibonacci retracement).
Additional Market Outlooks
Monetary vs Fiscal Policy: Implications for FX Markets
Gold Price Forecast: RSI Falls Back from Overbought Zone
Euro Forecast: EUR/USD Recovery Pulls RSI Out of Oversold Zone
USD/CAD Defends Post-BoC Reaction to Eye August High
--- Written by David Song, Senior Strategist
Follow on Twitter at @DavidJSong


