
US Dollar Talking Points:
- The USD sold off on Monday and Tuesday but then set the weekly low on Wednesday just after a Services PMI print. While the data printed below the expectation, the US Dollar quickly jumped from a fresh low and that low held into the end of the week.
- Thursday data showed elevation in initial jobless claims which would generally be considered a USD-negative factor given greater softness in the labor market. But the Dollar continued to show strength through the Friday NFP report which, again, saw a bullish reaction to a slate of data that wasn’t all that positive. The focus now shifts to next week’s CPI report.
- I’ll be discussing these themes in-depth in the weekly webinar on Tuesday at 1PM ET. It’s free for all to register: Click here to register.
The week was backloaded with US data as the Wednesday release of Services PMI numbers was followed by the Friday NFP report. The jobs report is somewhat of a peculiarity at this point as this was released on Good Friday, when many exchanges were closed, so it would be difficult to gauge reaction at this early juncture given that many markets haven’t yet had the opportunity to price it in.
Nonetheless, there was continuation of a theme that began to show on Wednesday, and remains of interest into next week. The US Dollar sold off on Monday and Tuesday, continuing its descent that began in Q4 of last year. Support eventually came into play on Tuesday around 101.53, which held the low into Wednesday at which point the Services PMI data was released. The expectation was for 54.5 but the data came in at 51.2 – so a disappointment against the expectation but still in expansion territory.
The initial reaction was a quick push down to a fresh low but that didn’t last for long, as USD bulls soon showed up and pushed prices up to a higher-high. That continued through Thursday, even as initial jobless claims came out above expectations. And then again on Friday after the release of Non-farm Payrolls, which wasn’t all that strong. The headline print missed the expectation, coming in at +236k against an expectation of +239k, and Average Hourly Earnings, the inflation component of the report, was also below expectations at 4.2% vs 4.3% YoY.
US Dollar - DXY Two-Hour Price Chart (indicative only, not available on Forex.com platforms)
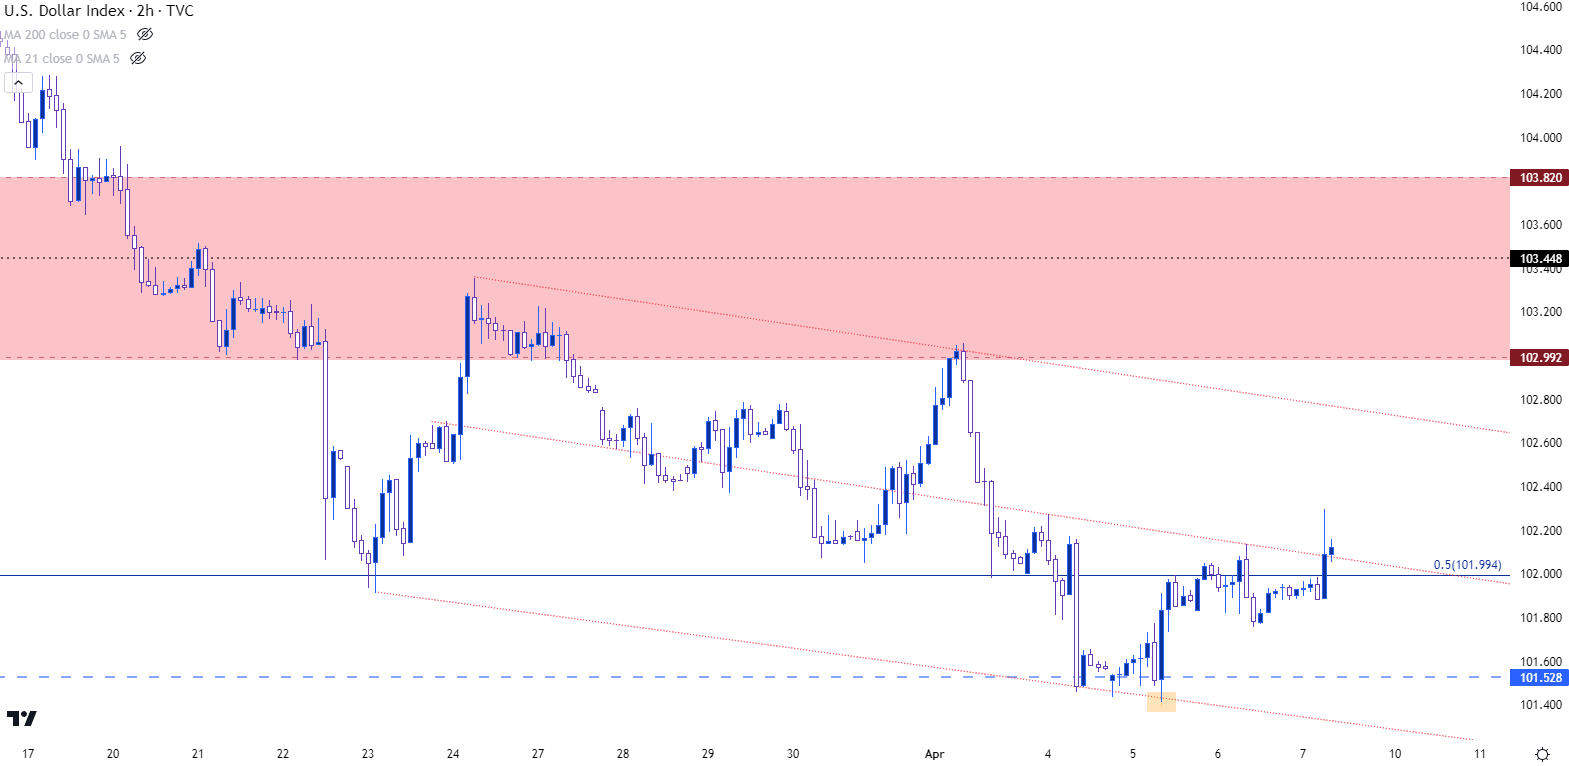 Chart prepared by James Stanley; data derived from Tradingview
US Dollar into Next Week
The big question for next week is whether this appearance of USD strength can continue. There’s a couple of major factors at-play there, key of which is the CPI report that’s set to be released on Wednesday morning, with the expectation for CPI to fall down to 5.5% for core inflation. But – also key is the largest component of DXY in EUR/USD – which continues to hold below a massive zone of resistance sitting overhead around the 1.1000 handle. I looked at that last week and that resistance remains in-play.
For the USD – the price zone of interest is the same 103-103.82 area that’s been in-play since December. This area was support on multiple occasions and more recently it’s come into the equation as resistance. If bulls can punch through that – there could be greater potential to bullish reversal scenarios in the currency, but that’s likely going to remain contingent on continued weakness in counterparties like the Euro or British Pound.
US Dollar Daily Price Chart
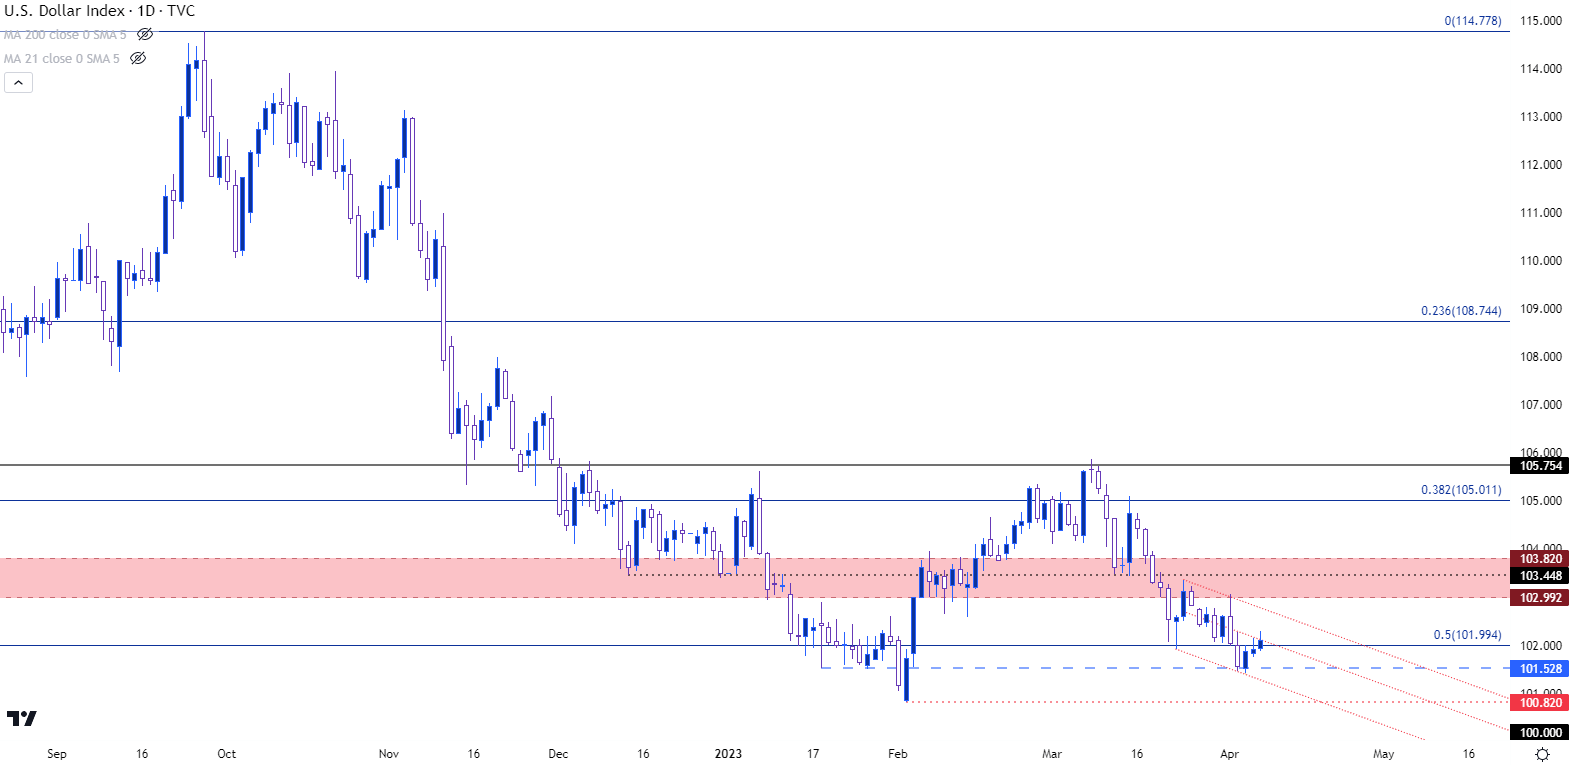 Chart prepared by James Stanley; data derived from Tradingview
EUR/USD
EUR/USD started the week with strength, pushing up to a fresh two month high on Tuesday and making an approach at the 1.1000 psychological level. Bulls couldn’t quite get up to the big figure, however, and that led to a pullback to support of 1.0883, after which a bounce developed into a lower-high.
When NFP was released on Friday the initial reaction in EUR/USD was weakness, until another support response showed at that 1.0883 spot. From the daily chart, it would appear that we haven’t quite met the conditions for capitulation, as this week marked a continuation of higher-highs and a hold of higher-low support. But the fact that this happened where it did, around the 1.1000 handle where there’s a few other items of resistance, keeps potential for swings in the mix.
For resistance next week – the big level is 1.1033 which marks the current yearly high and is at a key Fibonacci level. If bulls can hold a break above that, then USD-strength scenarios probably won’t be looking too attractive. But, if sellers can hold the line of resistance around 1.1033 or perhaps even 1.1000, the door could remain open for bearish swing potential, with supports at 1.0802 and 1.0747 sitting below current price action.
EUR/USD Daily Price Chart
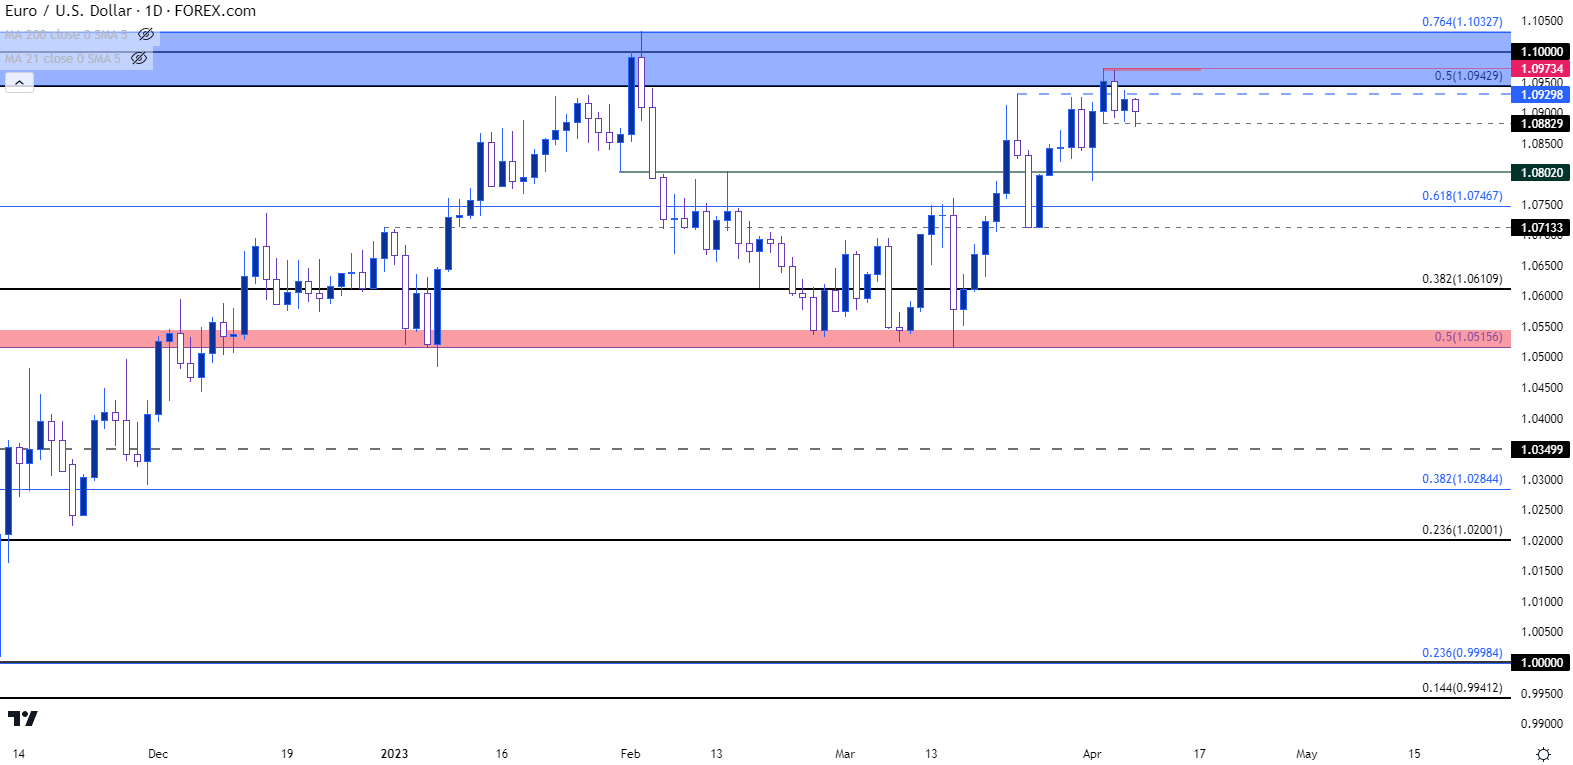 Chart prepared by James Stanley, EUR/USD on Tradingview
GBP/USD
Cable traded above the 1.2500 handle for the first time since last June. But, like EUR/USD, prices began to pullback after the Tuesday high. The pullback in the latter-portion of the week remained fairly consistent, with support showing at prior spots of resistance around 1.2443, 1.2423 and then 1.2398. There’s another spot of short-term support around 1.2362 after which the 1.2297 Fibonacci level comes back into the picture.
That price has appeared as a pretty important decision point in the pair over the past four months, with multiple cases of both resistance and support. If bulls fail to hold prices above that level, the door opens for range-continuation scenarios, with supports around 1.2182 and 1.2047 in the equation.
GBP/USD Daily Chart
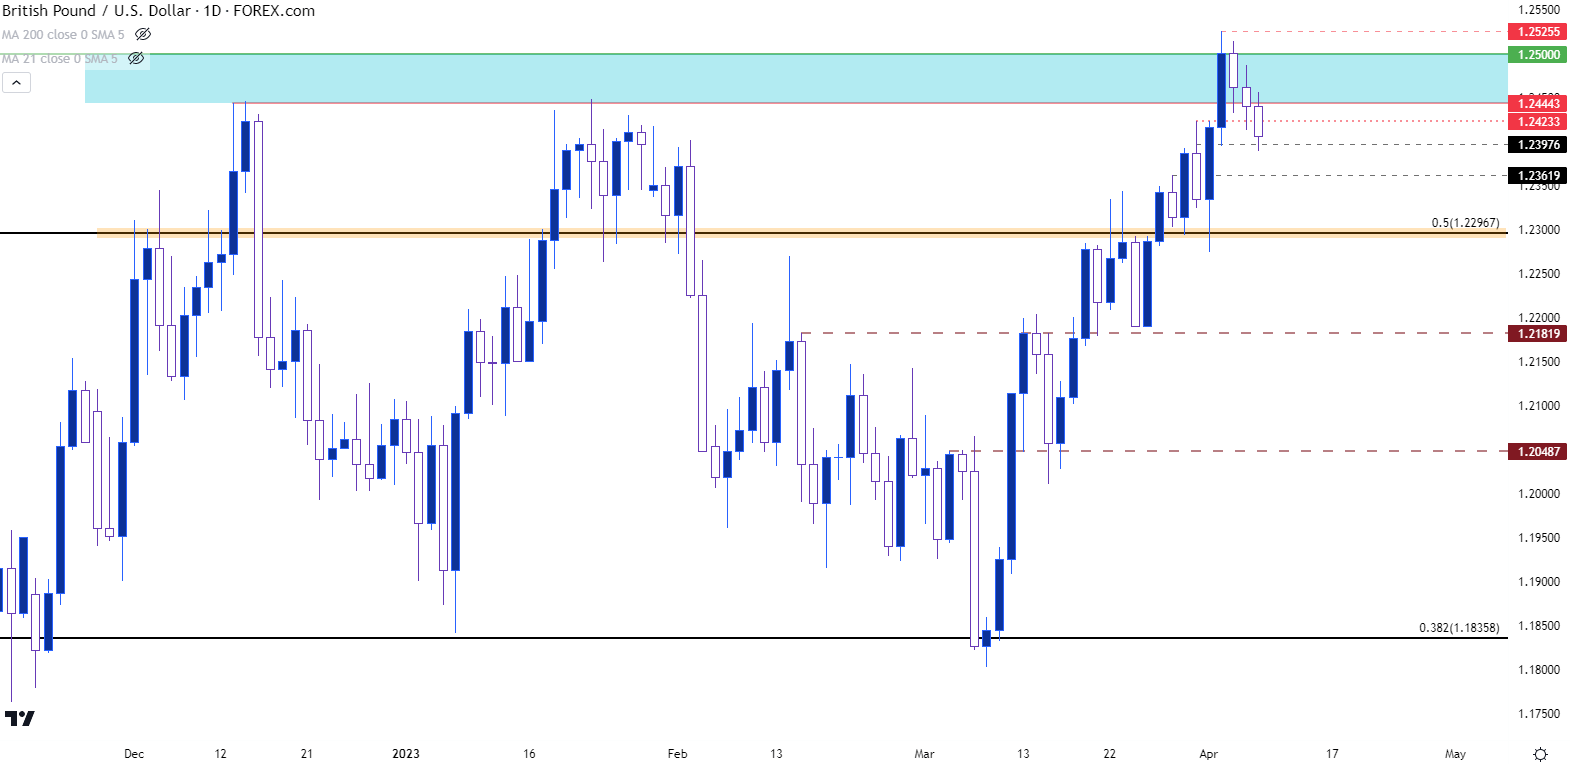 Chart prepared by James Stanley, GBP/USD on Tradingview
USD/CAD
USD/CAD came into the week with continuation of the intense sell-off that showed up in the week prior. Sellers made a fast approach for the 1.3400 handle, before the late-week USD theme of strength showed up, helping to bring a bounce of more than 100 pips.
From the weekly chart, price is working on a hammer formation. This isn’t completed yet so still needs to be confirmed but, if so, a hammer or a dragonfly doji after a strong sell-off can open the door for bounce potential, particularly if there’s a weekly close above the 1.3500 handle. This would put focus back on a key Fibonacci level at 1.3652, after which resistance appears around 1.3700 and 1.3800 levels.
USD/CAD Weekly Price Chart
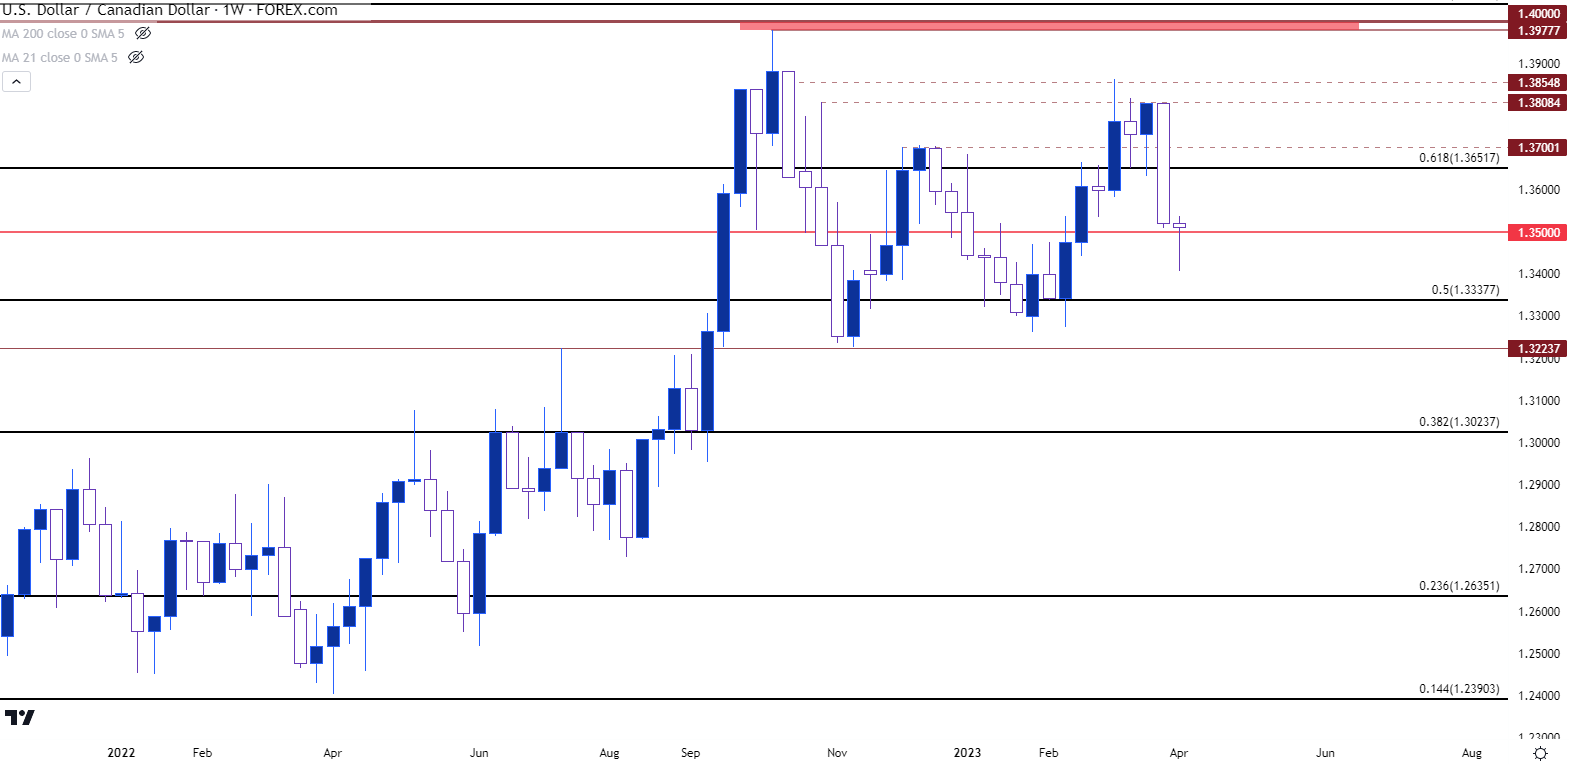 Chart prepared by James Stanley, USD/CAD on Tradingview
USD/JPY
I looked into USD/JPY on Wednesday as a key spot of support was coming into play. That area helped to hold the low for the week as a bounce began to develop.
The big question here is whether the longer-term downtrend remains in-force, as we’ve seen recent holds of key resistance at 135.00 and 133.09; or whether the more recent build of higher-lows may be leading into another trend or theme.
On the higher-low front, the 127.27 Fibonacci level is key, but late-March trade saw the 130.00 level come into play and that led to a bounce of more than 400 pips. The 133.09 area did help to hold the highs on the daily chart, but then last week saw another higher-low at the zone noted earlier, from around 130.41-130.79.
For next week – 133.09 is back in the picture and if bulls can force a daily close above that level, the focus then shifts to 133.76 and then the 135.00 psychological level. Near-term support is at 131.75, after which the 130.41-130.79 zone comes back into the picture, which is followed by the 130.00 level.
For big-picture bearish continuation scenarios – that would be the major level of interest as a breach of that opens the door for re-test of the 127.27 Fibonacci level.
USD/JPY Four-Hour Price Chart
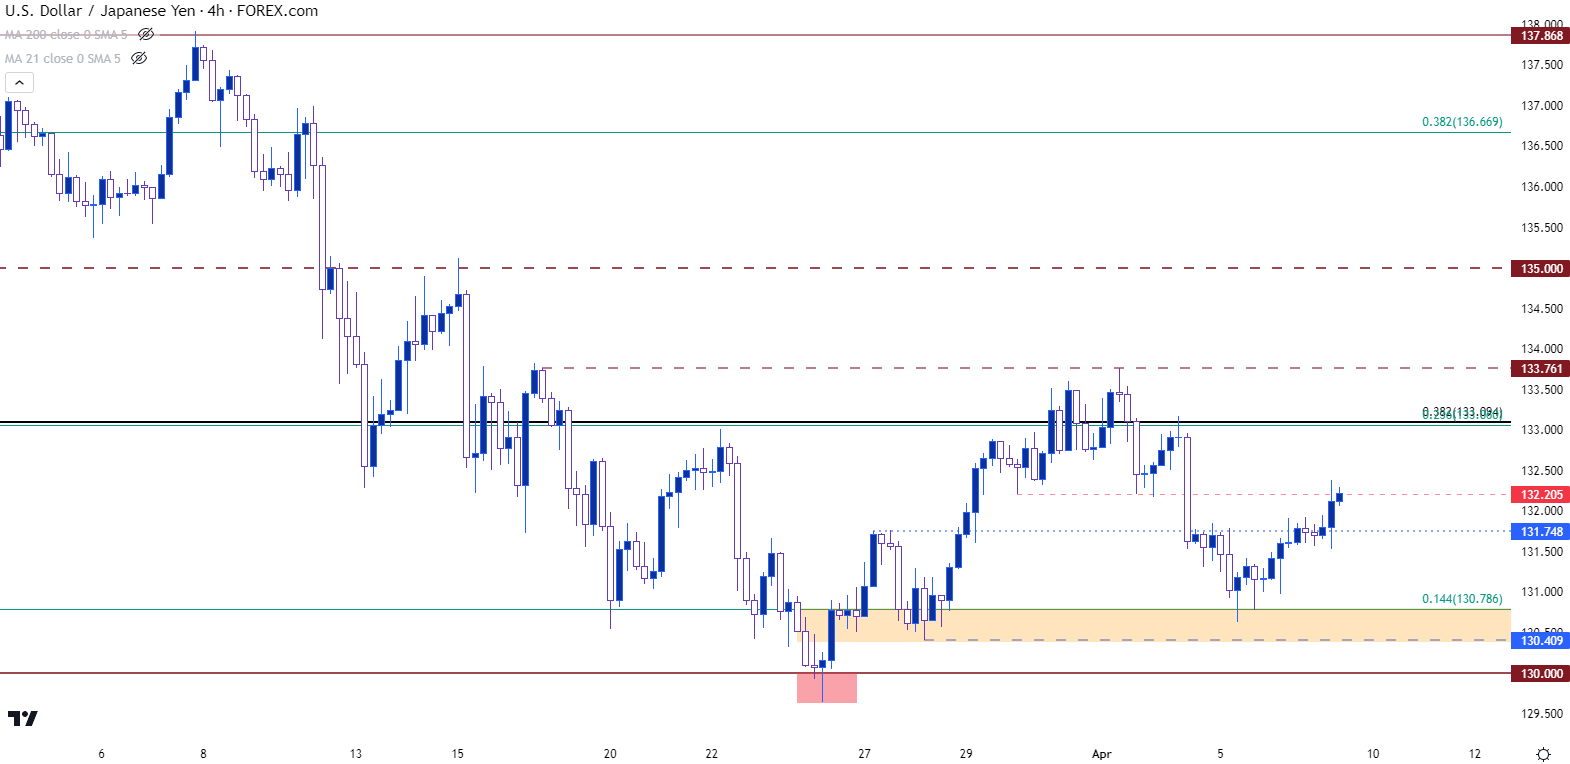 Chart prepared by James Stanley, USD/JPY on Tradingview
--- written by James Stanley, Senior Strategist
Follow James on Twitter @JStanleyFX
