US Dollar, USD/JPY Talking Points:
- The US Dollar tested a breakdown during the early-part of the FOMC rate decision yesterday, but sellers have so far failed to continue the move.
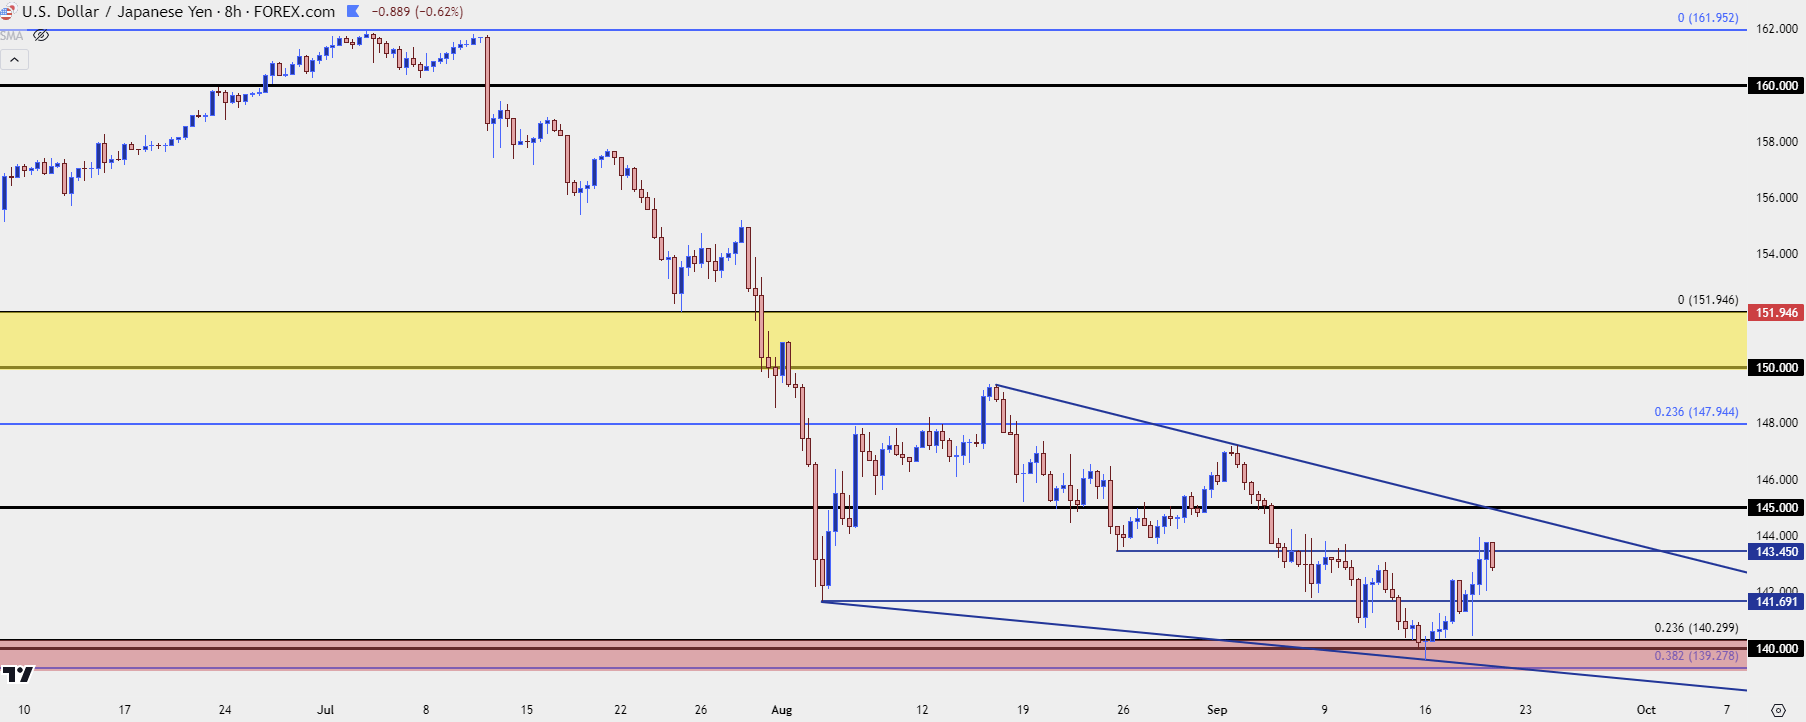
- As discussed in the article yesterday afternoon, USD/JPY would likely play a big role here and so far the pair extended the bounce at last night’s Asian session. Given the fact that the fundamental backdrop is now even less attractive for longs, the technical backdrop does not match the fundamentals, suggesting something else is afoot, which could be driven by short-cover from a shorter-term oversold situation. This puts focus on resistance at 145.00 if that bounce can continue.
- I’ll be looking into these setups in the Tuesday webinar and you’re welcome to join, click here for registration information.
As looked at in yesterday’s post-Fed video and article, it can take time for a FOMC reaction to price through, and it seems as though we’re still in the early stages of that.
Interestingly the fundamental case for the long side of USD/JPY is even less attractive as rate divergence between the US and Japan has narrowed after yesterday’s 50 bp cut. And given projections, that’s likely to continue. Given that the pair hasn’t even tested the 38.2% retracement of the trend produced by the carry trade, there could reasonably be more weakness to show if we’re looking purely at fundamentals. But that hasn’t been the case as USD/JPY held a higher-low at yesterday’s FOMC announcement and drove up for a resistance test at 143.45 in the Asian session yesterday.
But just because we haven’t seen carry traders unwind yet – does not mean that we won’t. We’re still in the early stages of that fundamental theme.
The big item here is going to be follow-through response: Whether longer-term USD/JPY longs use the bounce to close off positions opened during the up-trend when the carry trade was driving higher. The fact that this didn’t show after the rate cut suggest that short-term oversold conditions pushed short-cover in the pair.
In the video, I highlighted the 145.00 level as a deeper spot of resistance that could function as such. And, interestingly, USD/JPY has built a falling wedge formation after the early-week bounce at the 140.00 handle. The resistance side of that possible formation is confluent with the big figure at 145.00.
USD/JPY Eight-Hour Price Chart
 Chart prepared by James Stanley, USD/JPY on Tradingview
USD
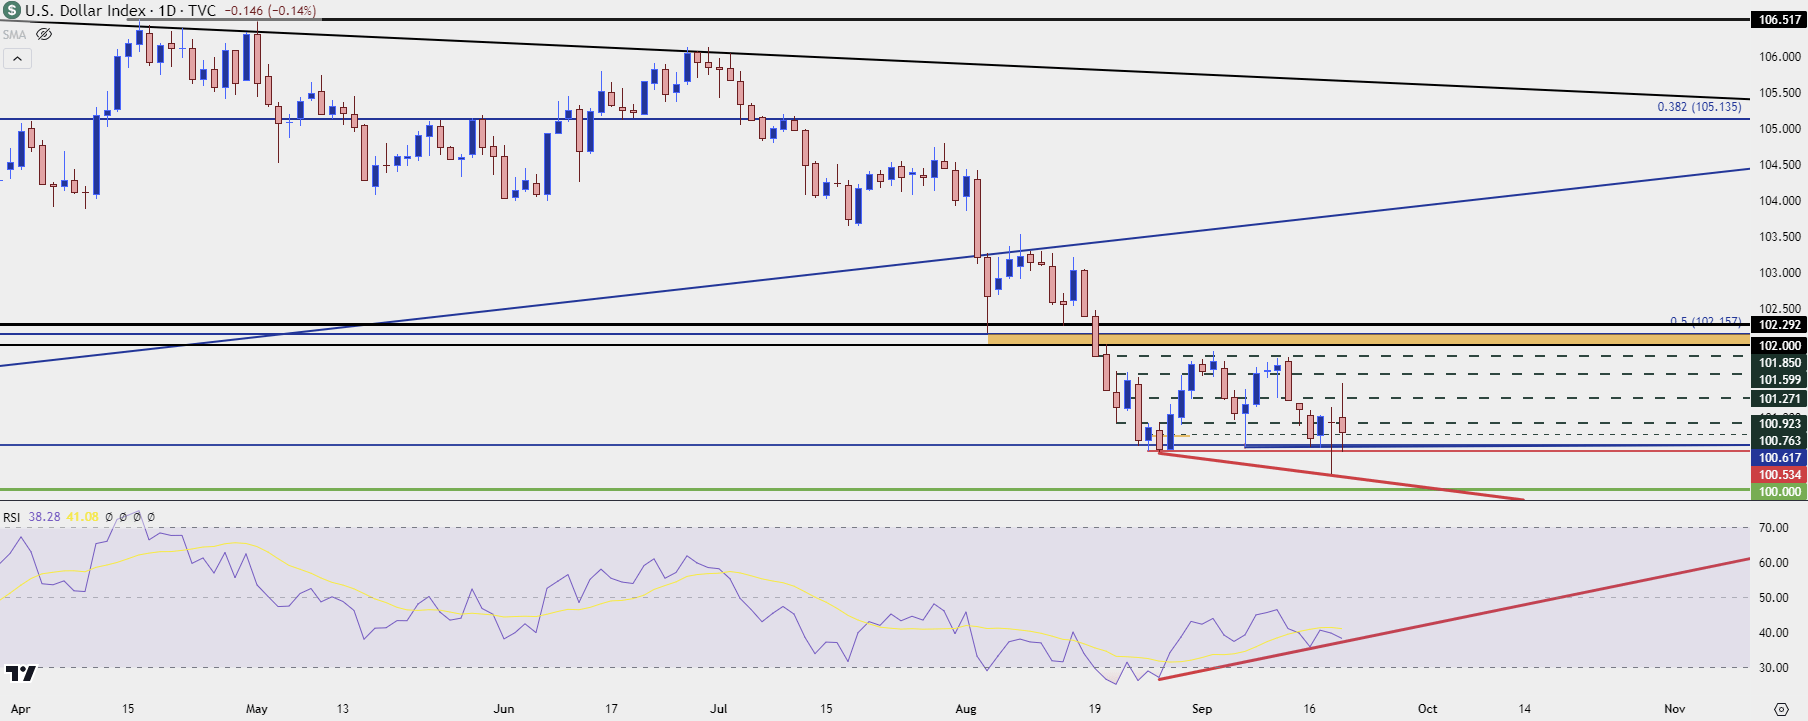
In USD, price action is still rather messy but as shown in the video, there’s been a hold of support at the prior August lows, around 100.52 in DXY. There’s also been a case of RSI divergence beginning to show on the daily chart and this follows the oversold RSI reading on the weekly chart from late last month.
US Dollar Daily Price Chart
 Chart prepared by James Stanley; data derived from Tradingview
USD Shorter-Term, Levels
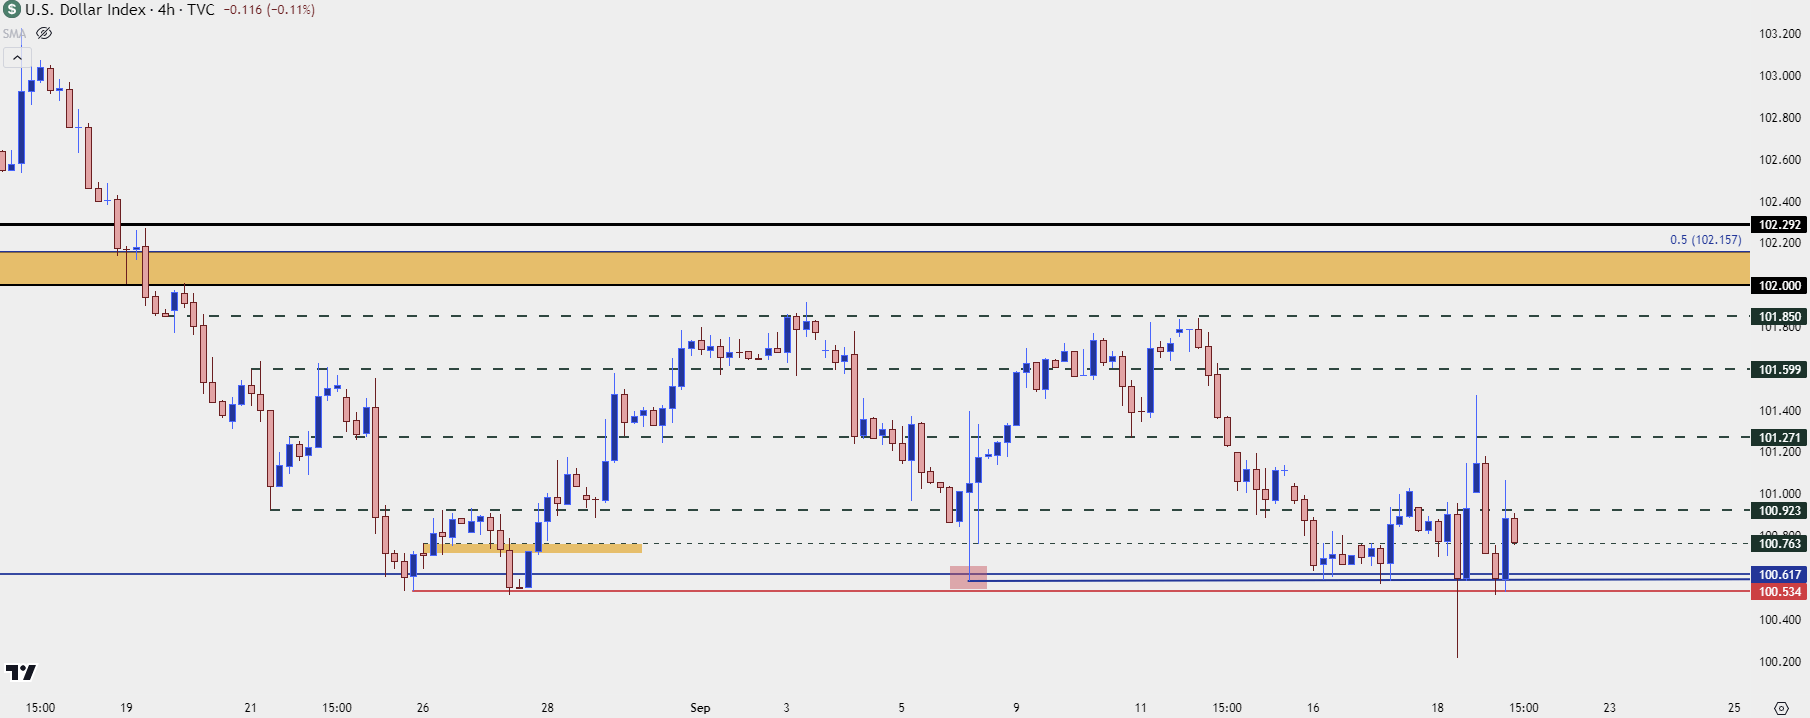
Yesterday’s FOMC statement helped to produce a fresh yearly low in DXY, but the move could not sustain. That pullback ran aggressively through the early-Asian session, with sellers returning ahead of the European open.
But the response to that could not re-test the lows and instead held a higher-low right at that same spot of support from late-August, around 100.52 in DXY. This sets up a messy four-hour DXY chart but that support defense is notable at this point, and this highlights the potential for range continuation to remain.
I still think the x-factor here is USD/JPY carry unwind and if we do see USD/JPY press below support, we could fast see DXY leg into a bearish trend. Given the calendar, tomorrow night or the Friday close would be a good spot to look for reaction or read from the Asian session, to see if we do get a larger unwind of longer-term USD/JPY carry positions.
For USD, I’m still tracking the same levels as last week with possible resistances at 100.92, 101.27, 101.60 and 101.85.
US Dollar Four-Hour Price Chart
 Chart prepared by James Stanley; data derived from Tradingview
--- written by James Stanley, Senior Strategist


