Weekly Technical Trade Levels on USD Majors, Commodities & Stocks
- Technical setups we’re tracking into the weekly open
- Next Weekly Strategy Webinar: Monday, June 12 at 8:30am EST
- Review the latest Weekly Strategy Webinars on my YouTube playlist.
In this webinar we take an in-depth look at the technical trade levels for US Dollar (DXY), Euro (EUR/USD), British Pound (GBP/USD), Australian Dollar (AUD/USD), Canadian Dollar (USD/CAD), Gold (XAU/USD), Silver (XAG/USD), Crude Oil (WTI), Japanese Yen (USD/JPY), EUR/JPY, S&P 500, Nasdaq and Dow Jones (DJI). These are the levels that matter this week.
US Dollar Index Price Chart – DXY Weekly

Chart Prepared by Michael Boutros, Sr. Technical Strategist; DXY on TradingView
We’ve been tracking this recovery in the US Dollar Index for some time now – the advance remains vulnerable near-term while below the objective yearly, high-week close at 104.64.
Yearly open support at 103.49 backed by 103- losses should be limited to this threshold IF price is heading higher on this stretch. A topside breach / close above this threshold exposes critical resistance at 105.69-106.15. Review my latest US Dollar Technical Forecast for a closer look at the this technical setup.
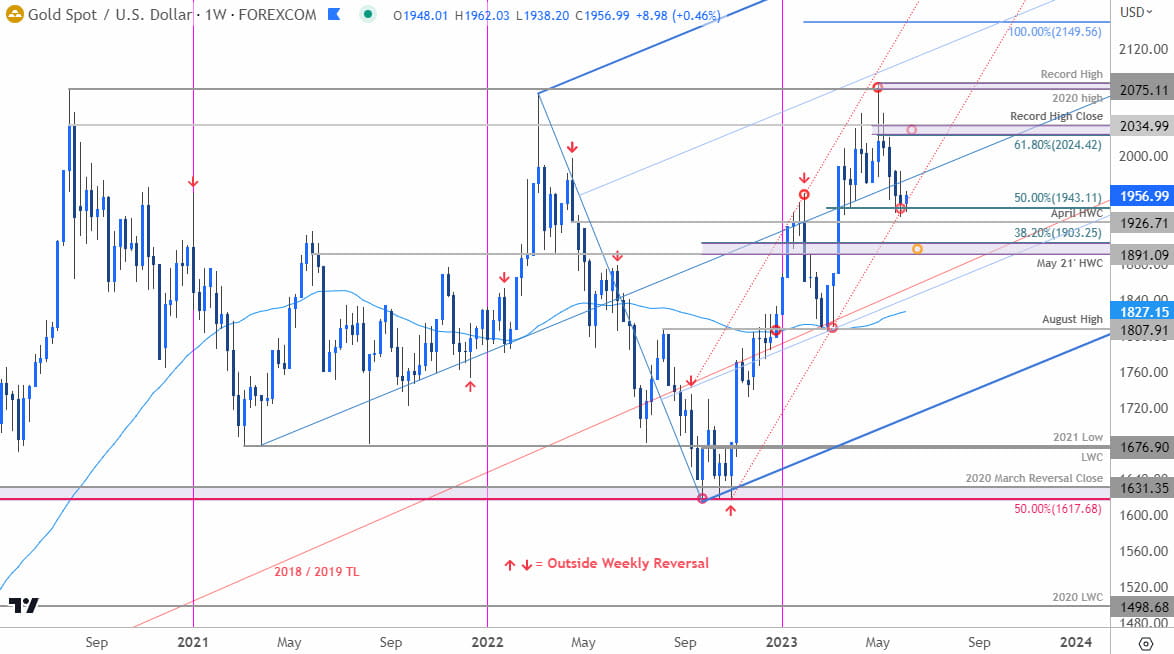
Gold Price Chart – XAU/USD Weekly

Chart Prepared by Michael Boutros, Sr. Technical Strategist; XAU/USD on TradingView
Gold has been spot-on! A decline of more than 7% off the highs is now testing confluent support around 1937/43- could get some kickback here. Initial resistance at the median-line (currently ~1980s) with the threat still for a deeper correction while below 2000.
Ultimately, a close below 1926 would be needed to validate a break of the October uptrend / suggest a larger correction is underway. Critical support at 1891-1903- look for larger reaction there IF reached. Review my latest Gold Short-term Price Outlook for a closer look at the near-term XAU/USD technical trade levels.
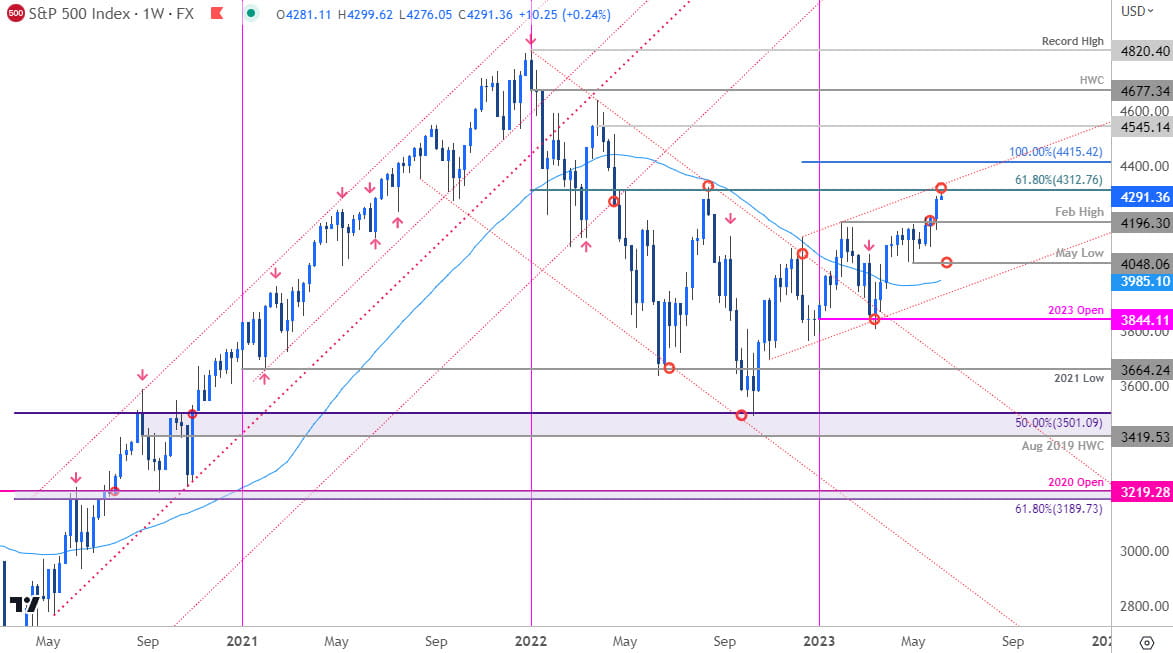
S&P 500 Chart – SPX500 Weekly

Chart Prepared by Michael Boutros, Sr. Technical Strategist; SPX500 on TradingView
The S&P 500 is now approaching the 61.8% Fibonacci retracement of the 2021 decline at 4312 with the uptrend resistance slope just higher (red). Looking for possible exhaustion / price inflection into this threshold.
Initial support at 4196 with medium-term bullish invalidation raised to the May lows at 4048. A topside breach / close above this level would expose the 100% extension of the entire 2022 advance a 4415. Get a closer look at this setup and more in my latest S&P 500, Nasdaq, Dow Technical Forecast.
--- Written by Michael Boutros, Sr Technical Strategist with FOREX.com
Follow Michael on Twitter @MBForex


