US Dollar Talking Points:
- The US Dollar held an early-week bounce that was completely priced-out after the release of Non-farm Payrolls on Friday.
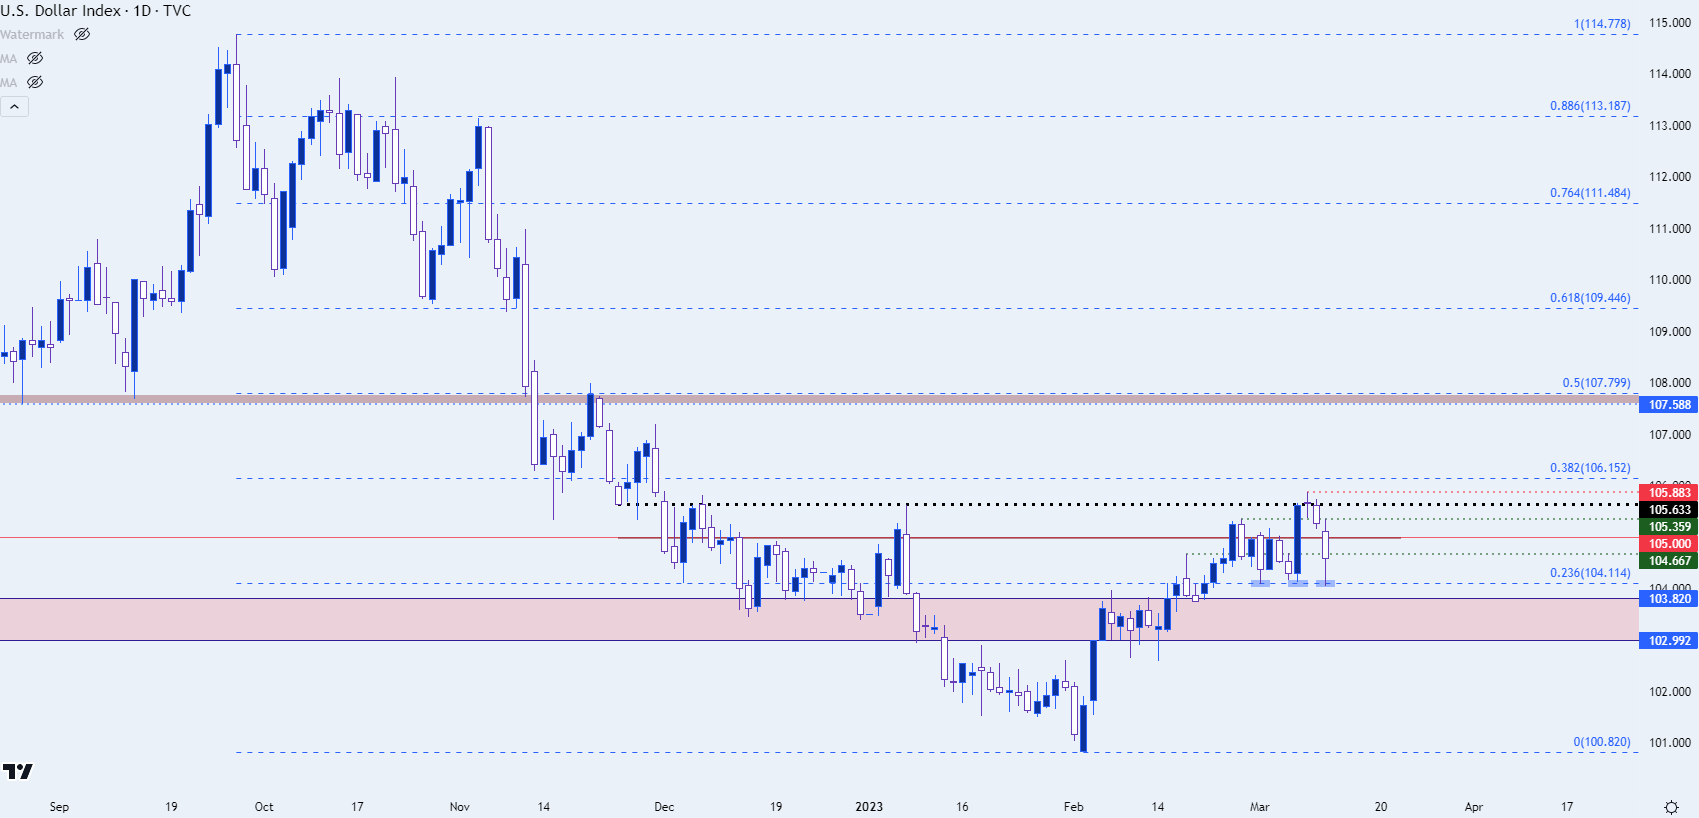
- USD support, as of this writing, has held at a key Fibonacci level that’s helped to hold the low over the past two weeks, setting the stage for next week’s CPI report.
- I’ll be discussing these themes in-depth in the weekly webinar on Tuesday at 1PM ET. It’s free for all to register: Click here to register.
The first half of the week brought a strong bounce to the USD as FOMC Chair Jerome Powell indicated that the bank may be looking to hike rates more than previously thought. This sent a quick shockwave through markets with the Dollar running higher, helping to tilt major currency pairs like EUR/USD and GBP/USD lower. Stocks and gold similarly fell on the back of higher rate fears and the US Treasury market put in some very fast moves with the Two year tagging the 5% marker as the 10 year tested above the 4% level.
Powell started to walk those comments back on Wednesday, adding an important qualifier of ‘if,’ saying that ‘if’ the economy required more rate hikes, the Fed was able to get more hawkish and hike rates more than previously expected. This seemed to be less committed than what he had said on Tuesday, and this helped the USD to find a bit of resistance at a fresh 2023 high before beginning to pullback.
Thursday is when matters really began to shift, however, as the Silvergate saga brought reverberation through the banking sector. This drove fear of contagion or adverse impact from a continued hawkish stance at the Fed combined with the stress that higher rate policy has produced. As banks were getting hit on Thursday, US Treasury rates began to fall and that continued through the Friday morning NFP report. That had a massive impact on the USD as the currency continued its descent until running into the same support level that’s been in-play since the March open, taken from the 23.6% Fibonacci retracement of the September-February sell-off.
US Dollar - DXY Daily Price Chart (indicative only, not available on Forex.com platforms)
 Chart prepared by James Stanley; data derived from Tradingview
US CPI, ECB Next Week’s Major Drivers
From the economic calendar there are two major events scheduled for next week. But as noted a moment ago, there’s another theme that’s brewing at the moment and that’s the potential for contagion in the banking sector, which is also worth keeping an eye on as that theme brought a large and related impact in the latter portion of the week.
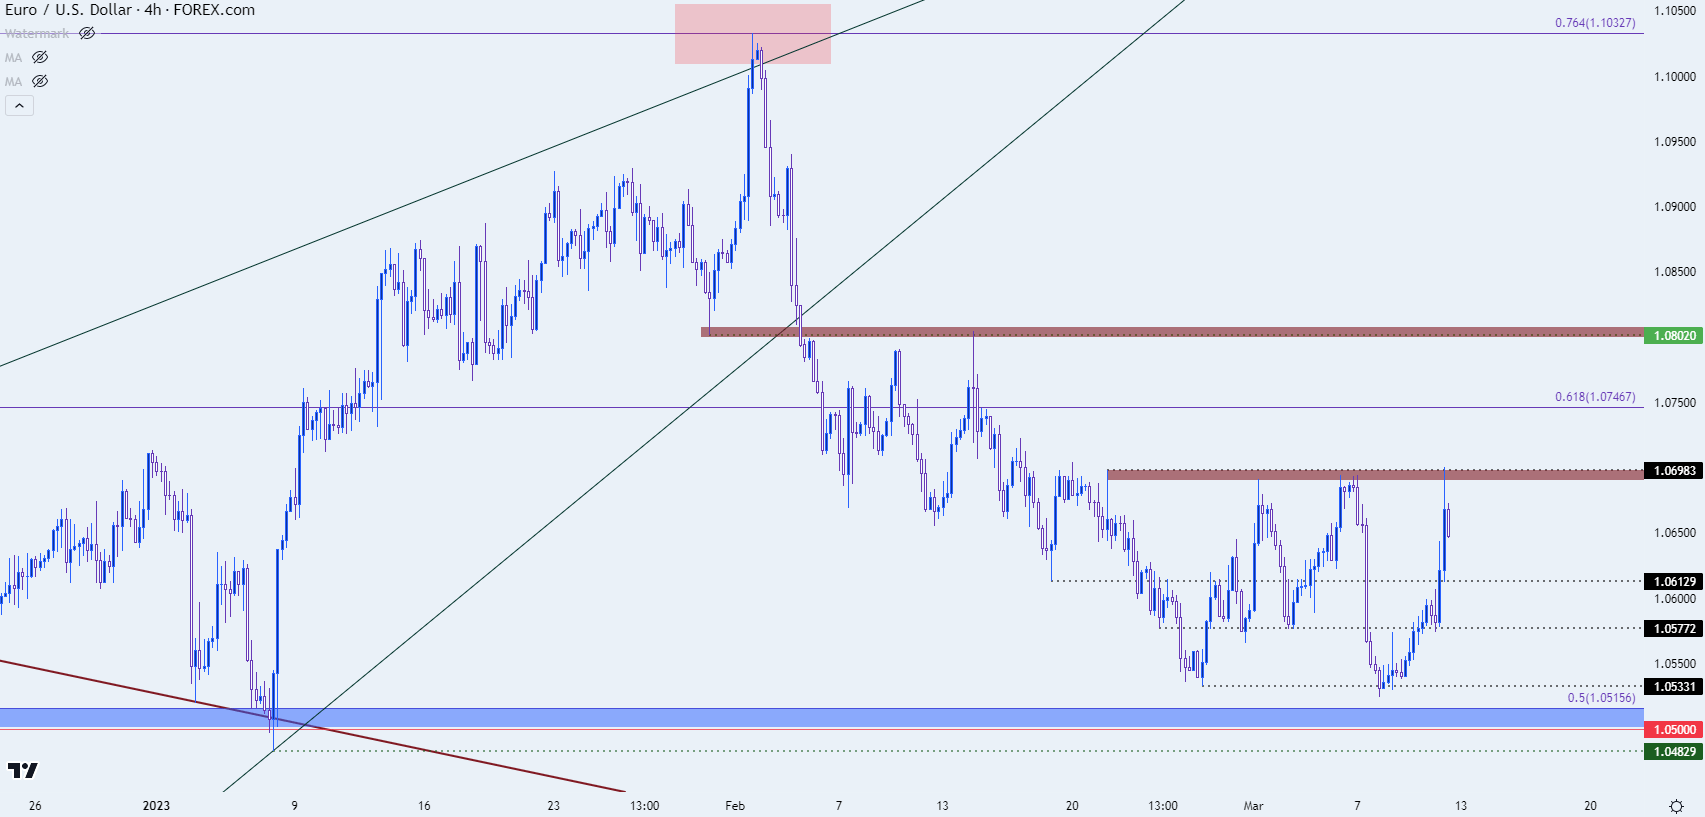
Regarding the ECB, expectations are set for a continued hawkish stance out of the European Central Bank along with the projection for another 50 bp hike. The EUR/USD pair has so far been range-bound through much of March, with resistance coming into play twice last week inside of the 1.0700 handle.
This sets up shorter-term support potential from inside of the range around 1.0613 and 1.0577. The current two-month-low is around 1.0533 and below that is a large zone of support with longer-term interest, as this is the same spot that helped to hold the lows in the beginning of the year.
If bulls are able to substantiate a more meaningful topside break, there’s resistance potential at 1.0747 after which 1.0802 comes into play.
EUR/USD Four-Hour Price Chart
 Chart prepared by James Stanley, EUR/USD on Tradingview
GBP/USD
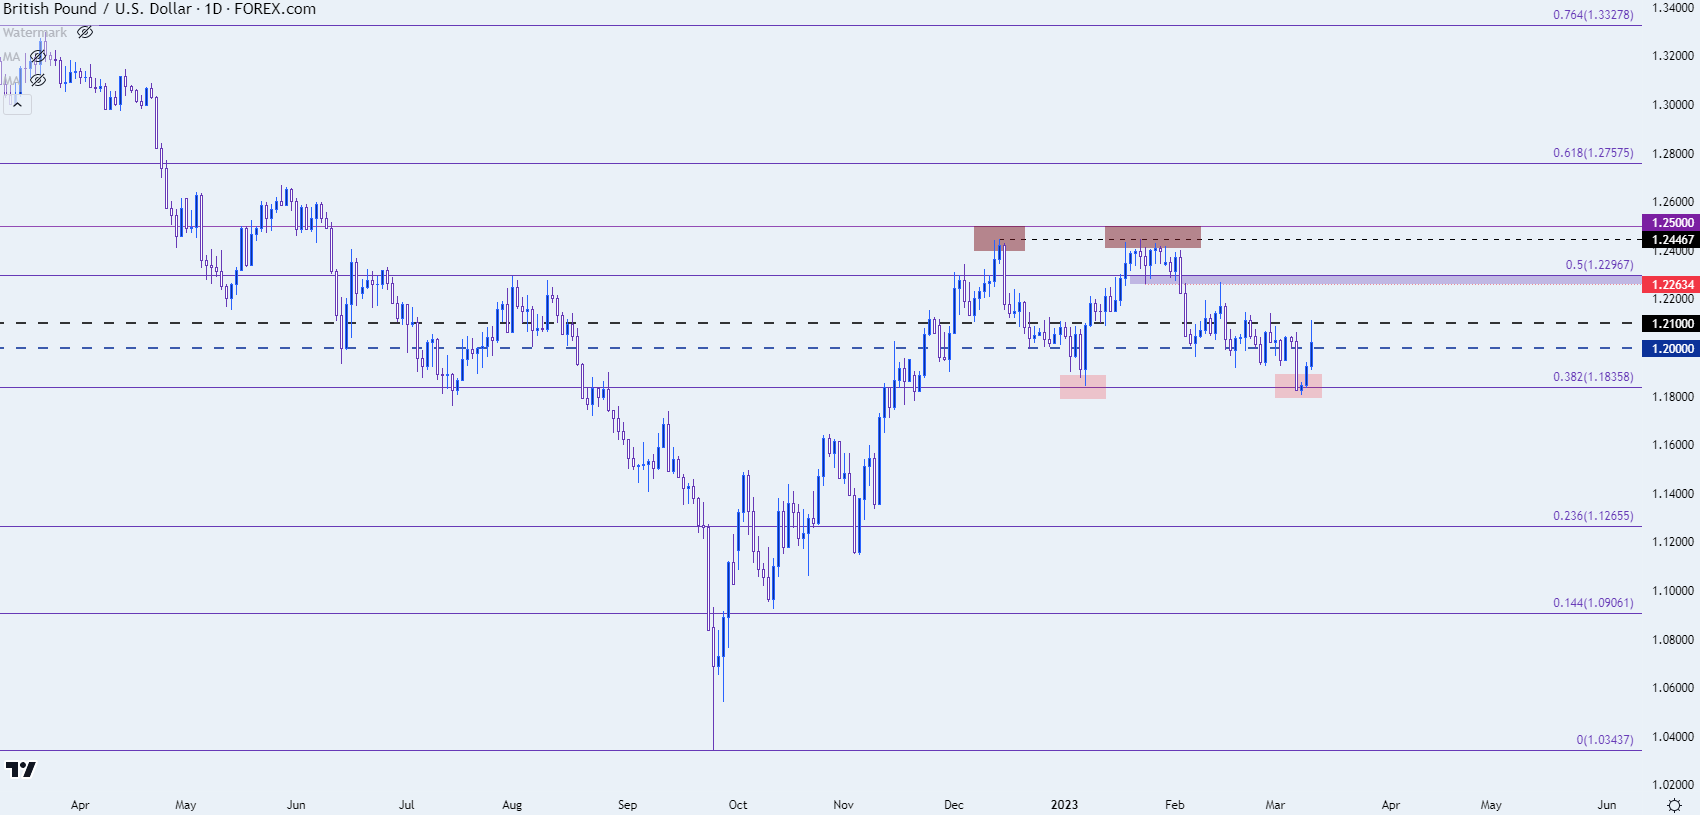
Cable teased a breakdown earlier in the week with price testing below a key spot of support at 1.1836. Sellers couldn’t substantiate much extension, however, and this led to a pullback for another test of the 1.2100 psychological level. Sellers showed a response there but similar to EUR/USD above, bears had an open door for a breakdown earlier in the week that they just could not walk through, and this puts focus on next week’s CPI report for directional USD biases.
At this point, GBP/USD has been range-bound since late-November, and follow-through resistance potential exists at 1.2263 before range resistance comes into play at 1.2447.
GBP/USD Daily Price Chart
 Chart prepared by James Stanley, GBP/USD on Tradingview
USD/JPY Support Test
The Bank of Japan hosted Governor Kuroda’s final meeting atop the bank on Thursday night/Friday morning and, at least initially, it looked as though Yen-strength themes would remain at bay, but that was nullified after the response to Non-farm Payrolls the following morning.
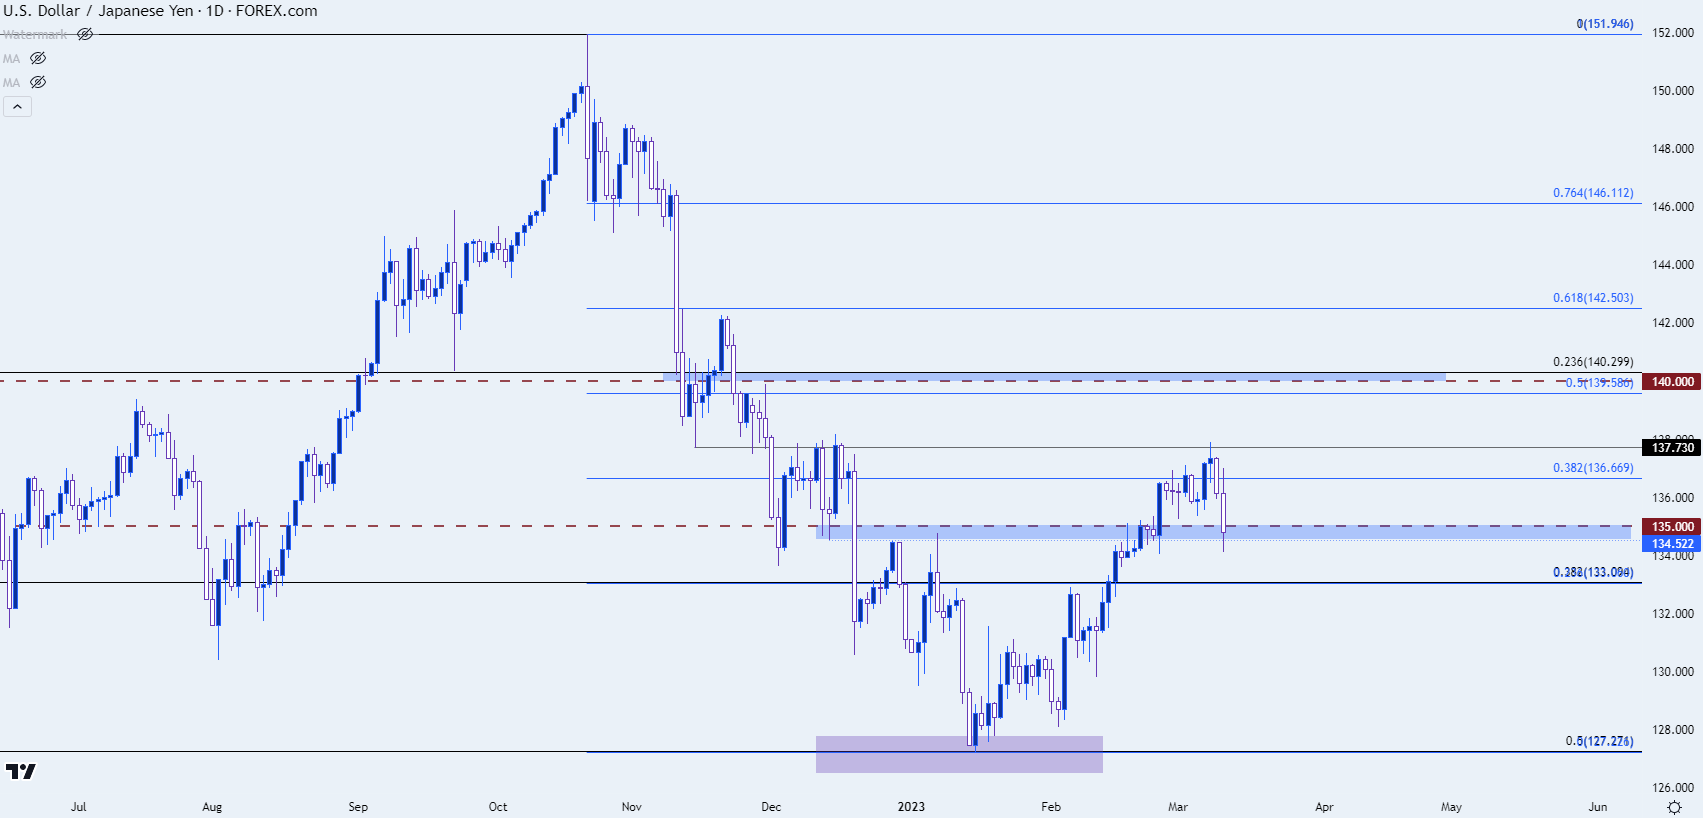
USD/JPY prices pulled back to a test of support at prior resistance, taken from around the 134.55 swing and plotted up to the 135.00 psychological level. There’s additional context for support at 133.09 as the trend over the past couple of months in the pair has continued to exhibit a series of higher-highs and lows.
A break-below 133.09 nullifies that streak and is a scenario that could come to fruition should risk aversion themes remain in-sight. While USD strength may tend to show during periods of risk aversion, given the impact of the carry trade over the past couple of years in the pair, we could fast see a carry unwind scenario that drives Yen-strength against USD weakness, particularly if that risk aversion theme is coupled with falling rates on the back of macro anxiety. And that theme of Yen-strength may even be extrapolated elsewhere, such as GBP/JPY.
USD/JPY Daily Price Chart
 Chart prepared by James Stanley, USD/JPY on Tradingview
--- written by James Stanley, Senior Strategist
Follow James on Twitter @JStanleyFX


