- Continued US economic strength, improved prospects for a Trump Presidency has traders questioning US interest rate outlook
- Markets pare pricing for Fed rate cuts this year by more than half since early September
- Key US two-year Treasury note futures sit above key technical level as rate cut expectations are pared
- A bearish break in futures may amplify US dollar strength
- DXY upside facing near-term technical challenges
Overview
Whether it reflects US economic exceptionalism reducing the need for large-scale rate cuts from the Federal Reserve or improved prospects for Donald Trump winning the US Presidential election, or a combination of both, it’s obvious the US interest rate outlook is dictating direction across FX markets.
Higher US yields are sucking capital from other parts of the world, helping to fuel US dollar strength. With short-dated Treasury futures teetering above a key technical level, what happens next could be highly influential in determining the path for currencies and global borrowing costs as we move towards year-end.
US economic growth accelerates again
The US economy looks to be picking up steam again with the latest update from the Atlanta Fed GDPNow model pointing to economic growth of 3.4% annualised in Q3, accelerating from the already brisk pace of 3% in Q2.

Source: Atlanta Fed
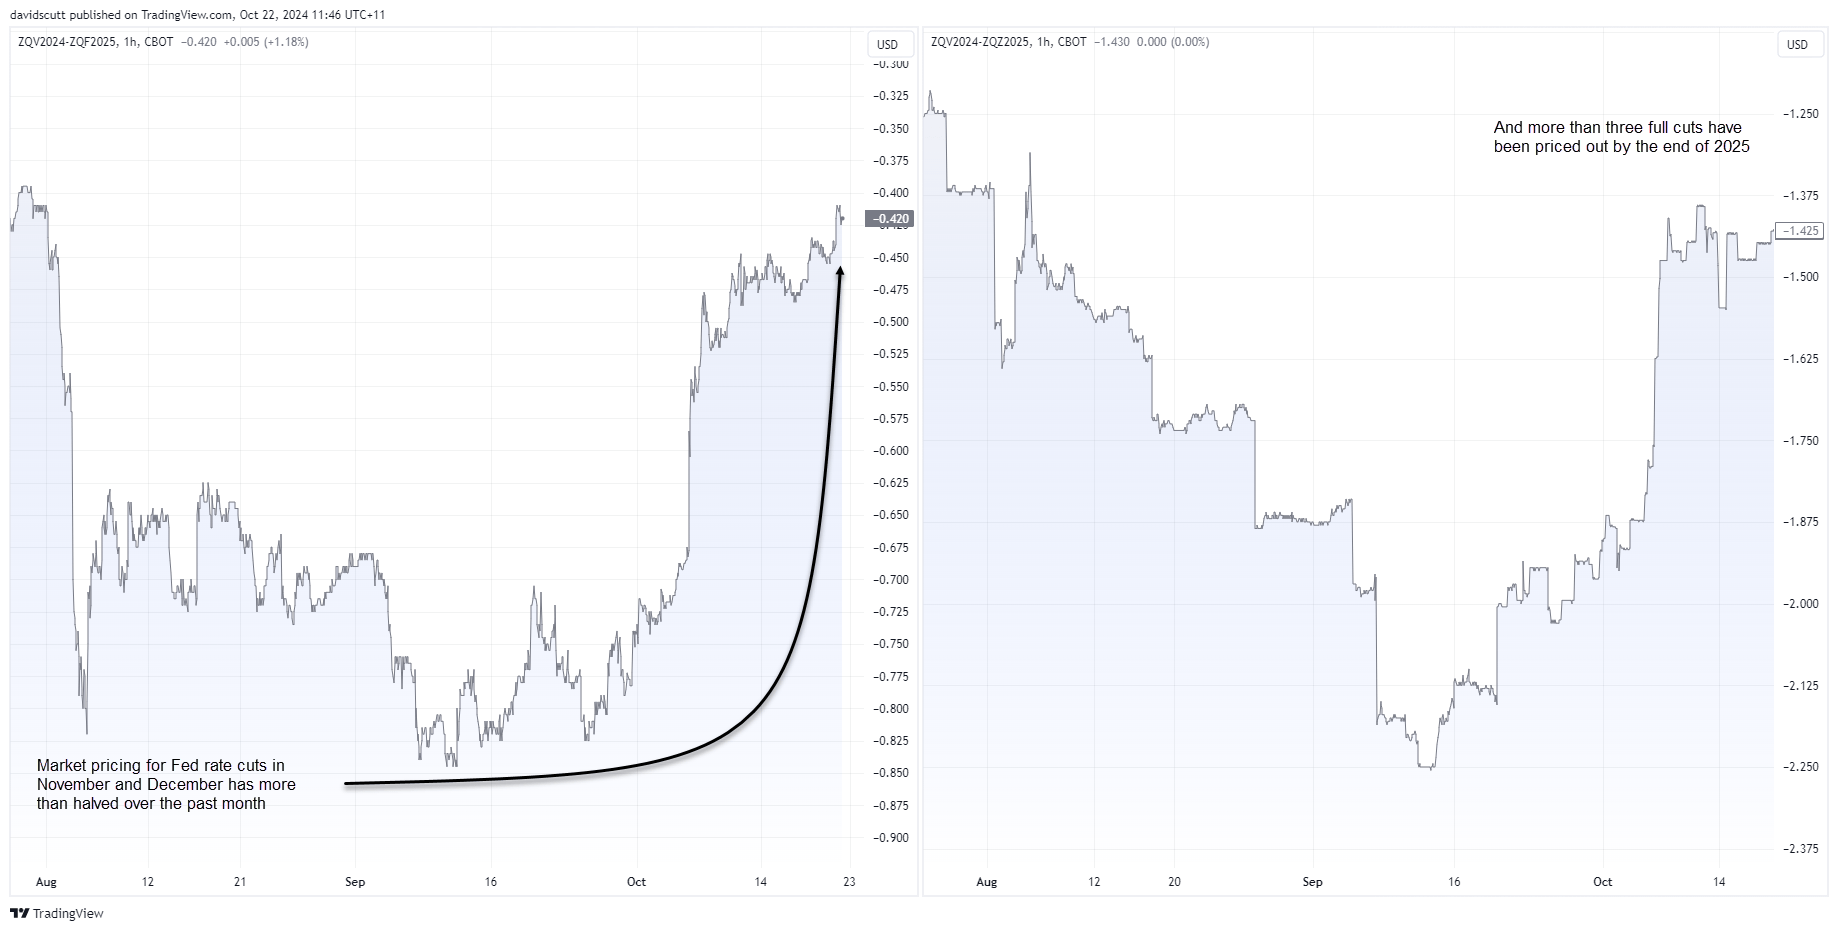
With an increasing proportion of US economic data topping expectations, traders are once again paring expectations on the scale of rate cuts from the Federal Reserve moving forward, mirroring what was seen earlier this year when market pricing went from over six rate cuts in 2024 to less than one.
And that has traders paring Fed rate cut bets
Right now, traders see around 42 basis points of cuts from the Fed over the remaining two meetings of 2024, a far cry from the 85 basis points of cuts that were priced a little over a month ago. Over the remainder of this year and next, less than six cuts are now priced, down from nine in early September.

Source: TradingView
It’s not that inflationary pressures have reappeared as they did back then, but with economic growth humming along at such a impressive pace, there’s concerns they could. By any modern-day assessment, the economy is growing beyond its estimated potential, pointing to downside risks for unemployment and upside risks for inflation as excess capacity is eradicated.
Trump policies may add to inflationary risks
And that’s before the prospect of Donald Trump returning to the White House is fully factored in.
His policy platform is reflationary by design, using tax cuts to boost demand. Trade measures, such as tariffs, could increase import costs dramatically, adding additional inflationary pressures to the mix. And if they’re not as protectionist as some fear, the prospect of stronger demand and restricted supply does not point to a disinflationary environment, limiting the ability for the Fed to cut rates.
Key US rates market teetering above key level
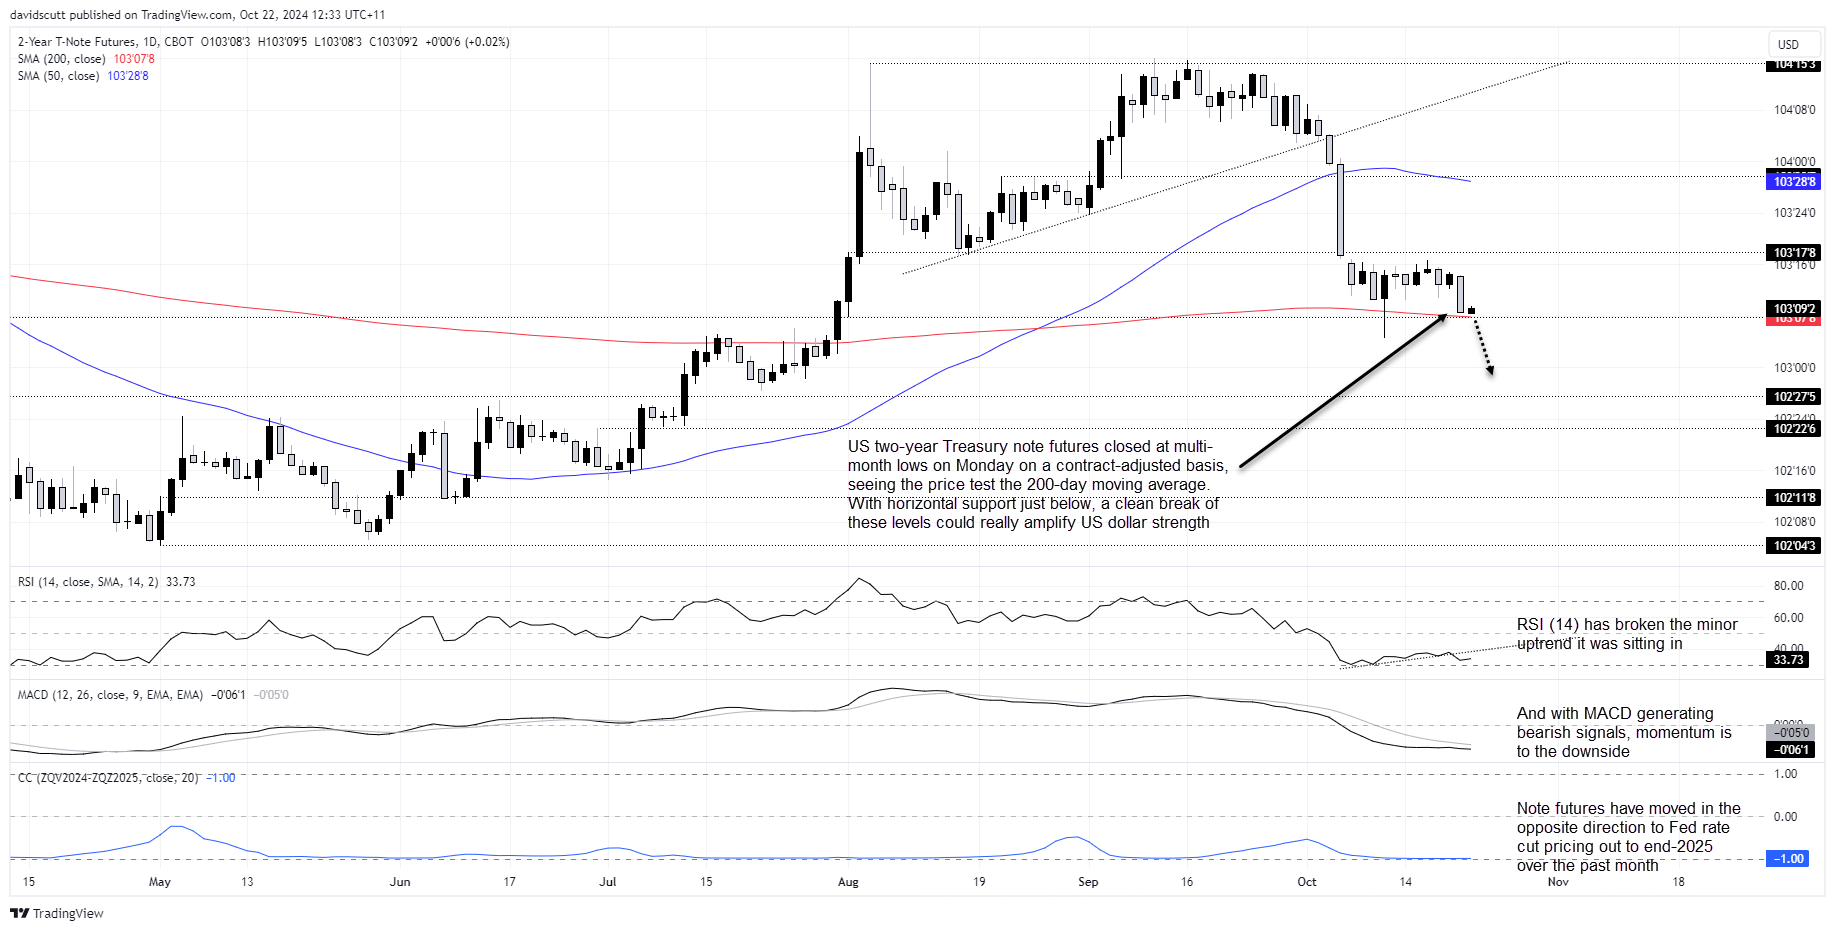
The shift in Fed rate cut expectations is flowing through to rates pricing further out the US Treasury curve, including for key two-year note futures which track price movements of two-year Treasury notes. Traders use these futures contracts to hedge or speculate on changes in short-term interest rates, making them popular for managing interest rate risk, especially during shifts in Federal Reserve policy.
As price moves inversely to yield, recent declines indicate two-year Treasury yields have been rising. The bottom pane in blue shows the influence Fed rate cut expectations are having on the futures contract, sitting with a rolling 20-day correlation of -1. Essentially, two-year yields have always moved in the opposite direction to Fed rate cut probabilities over the past month.

Source: TradingView
With two-year Treasury note futures sitting just above the 200-day moving average and long-running horizontal support just below, if we were to see these levels broken cleanly it may lead to further selling that implies higher Treasury yields. Increasing that risk, RSI (14) has broken the uptrend it was sitting in over recent weeks. With MACD confirming the bearish momentum signal. Downside risks for futures are growing.
For FX traders, rather than watching specifical levels, it’s the direction of travel for note futures that you should be more interested in near-term. When they’re falling, buying US dollar dips may prove to be a more successful strategy unless accompanied by a major risk-off episode for markets.
USD likely to move inversely to rate futures
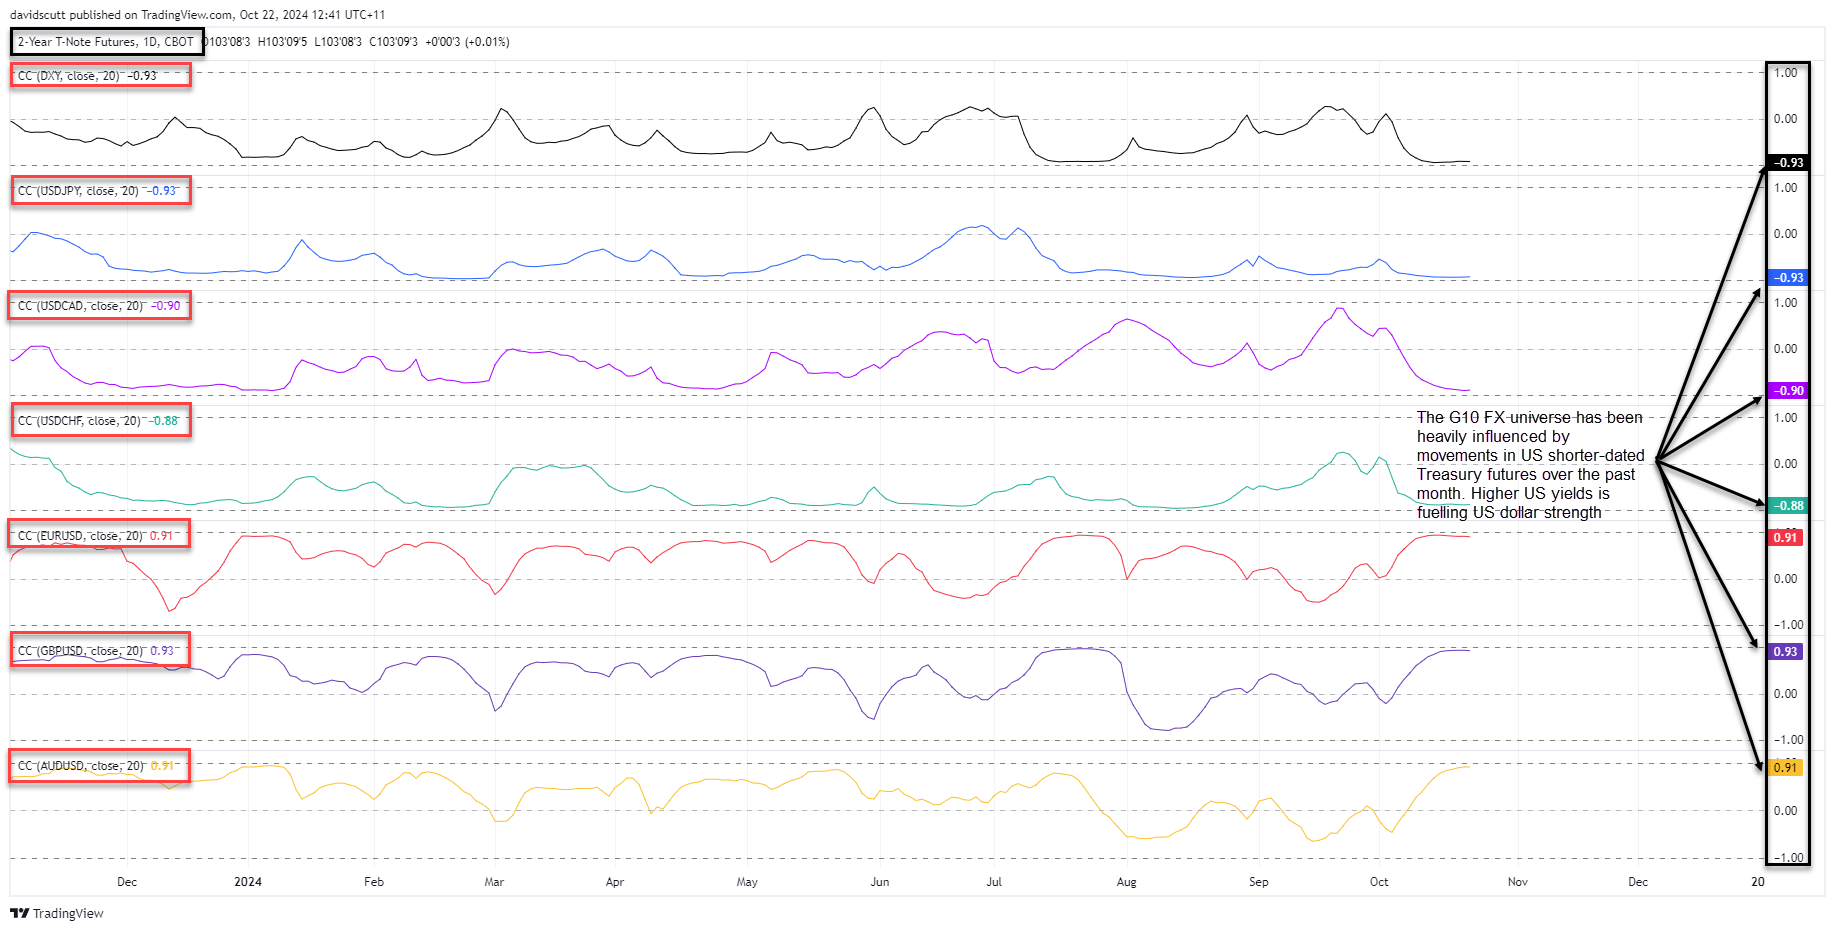
If we see another leg lower for two-year Treasury futures, it’s likely to translate to further US dollar strength given the strong relationship with major pairs seen over the past month.

Source: TradingView
The rolling 20-day correlation with the DXY, USD/JPY, USD/CAD and USD/CHF sits at -0.93, -0.93, -0.90 and -0.88 respectively, indicating they almost always move in the opposite direction to note futures. For EUR/USD. GBP/USD and AUD/USD, the correlation scores range between 0.91 to 0.93, implying they almost always move in the same direction.
Put simply, when two-year note futures decline, the US dollar usually strengthens.
DXY breaks 200DMA, eyes 104 hurdle

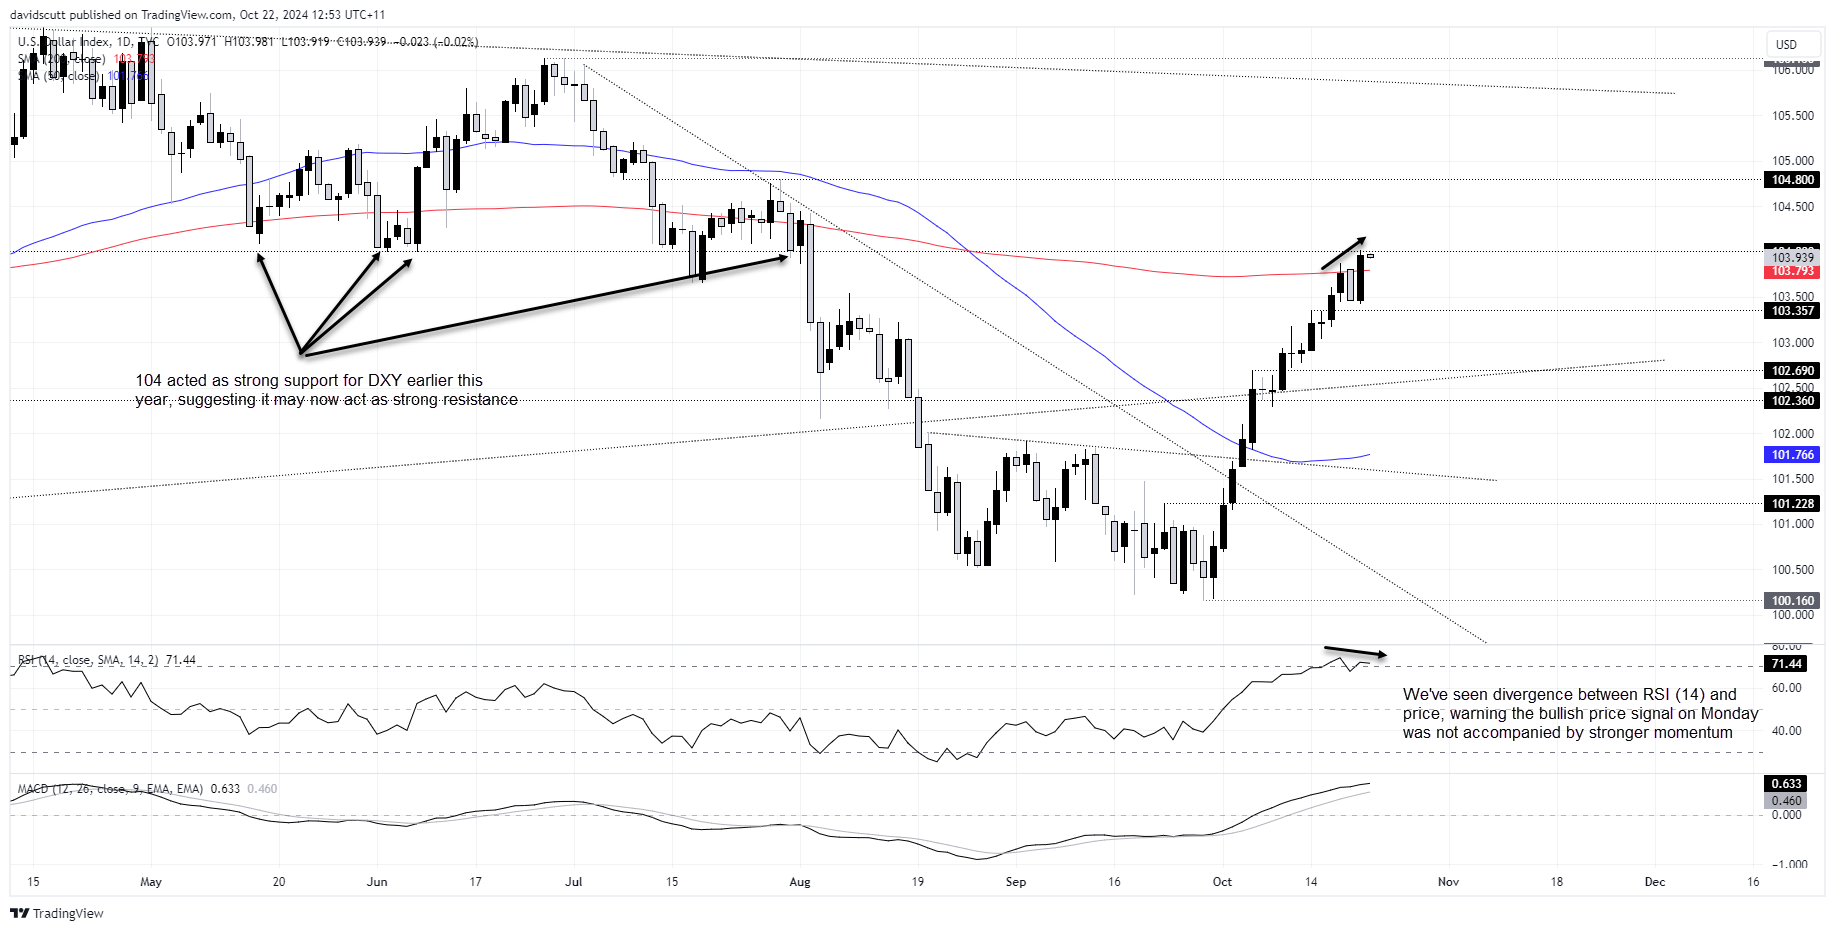
Making the proximity of US two-year Treasury futures to the 200-day moving average even more intriguing, and potentially important, the US dollar index (DXY) closed above its 200-day moving average for the first time since early August on Monday, printing a bullish engulfing candle that warned of potential upside to come.
104 is an important level overhead, often tested but rarely broken over the course of this year. Outside the false bearish break in July, it acted as strong support, hinting it may now act as strong resistance.
While Monday’s bullish engulfing candle suggests the level may be breached near-term, there’s no need to be pre-emptive, especially with RSI (14) recently diverging from price. DXY is also overbought on this indicator, creating the type of conditions that could easily see a near-term pullback.
Above 104, 104.80 and downtrend resistance around 105.90 are the levels to watch. Below, support is located at 103.357, 102.69 and again at 102.36.
-- Written by David Scutt
Follow David on Twitter @scutty


