US Dollar Talking Points:
- The US Dollar is nearing the completion of Q1 with a net loss over the quarter. Weakness in January led to strength in February, but sellers came back in March to erase much of that bullish move.
- In Q2 the big question is whether the Fed backs down from rate hikes. At this point, there’s a roughly 50% expectation for another 25 bp hike in May, but cuts begin to price-in around the July FOMC rate decision. If this is to happen, we’d likely get some element of indication from the Fed at the June meeting, scheduled to be announced on June 14th.
- I’ll be discussing these themes in-depth in the weekly webinar on Tuesday at 1PM ET. It’s free for all to register: Click here to register.
We’re winding down the end of Q1 and this was another bearish outing for the Greenback. While there was a spurt of strength that showed in early-February, helped along by a massive NFP release, sellers came back in March to erase a bulk of that prior move. While the Fed has yet to relent on rate hikes, markets have continually built in the expectation for some continued softening at the bank and the appearance of a banking crisis earlier in March only prodded that theme of lower rates even further.
But it’s the rise of rate expectations around Europe that have been problematic for USD bulls. The European Central Bank suspended forward guidance last year and this has allowed markets to run off of innuendo or hints around rate policy from the European Central Bank. And with inflation remaining elevated, the ECB has continued to point to the need for further hikes in effort of bringing inflation down.
That discrepancy in rate expectations has boosted the Euro and hit the US Dollar and given the outsize allocation of the Euro in the DXY quote these relationships matter quite a bit to each other.
So, on that note, the big question around the Greenback for Q2 is two-fold. Firstly, does the Fed continue to moderate their rate hike stance – or do they signal another hike for June? Secondly – does the ECB continue to hike aggressively in effort of offsetting their own inflationary dilemma. And perhaps related, does the banking crisis that showed in the United States make another re-appearance in Europe – and would that compel the ECB to take a softer stance towards rate policy?
US Dollar
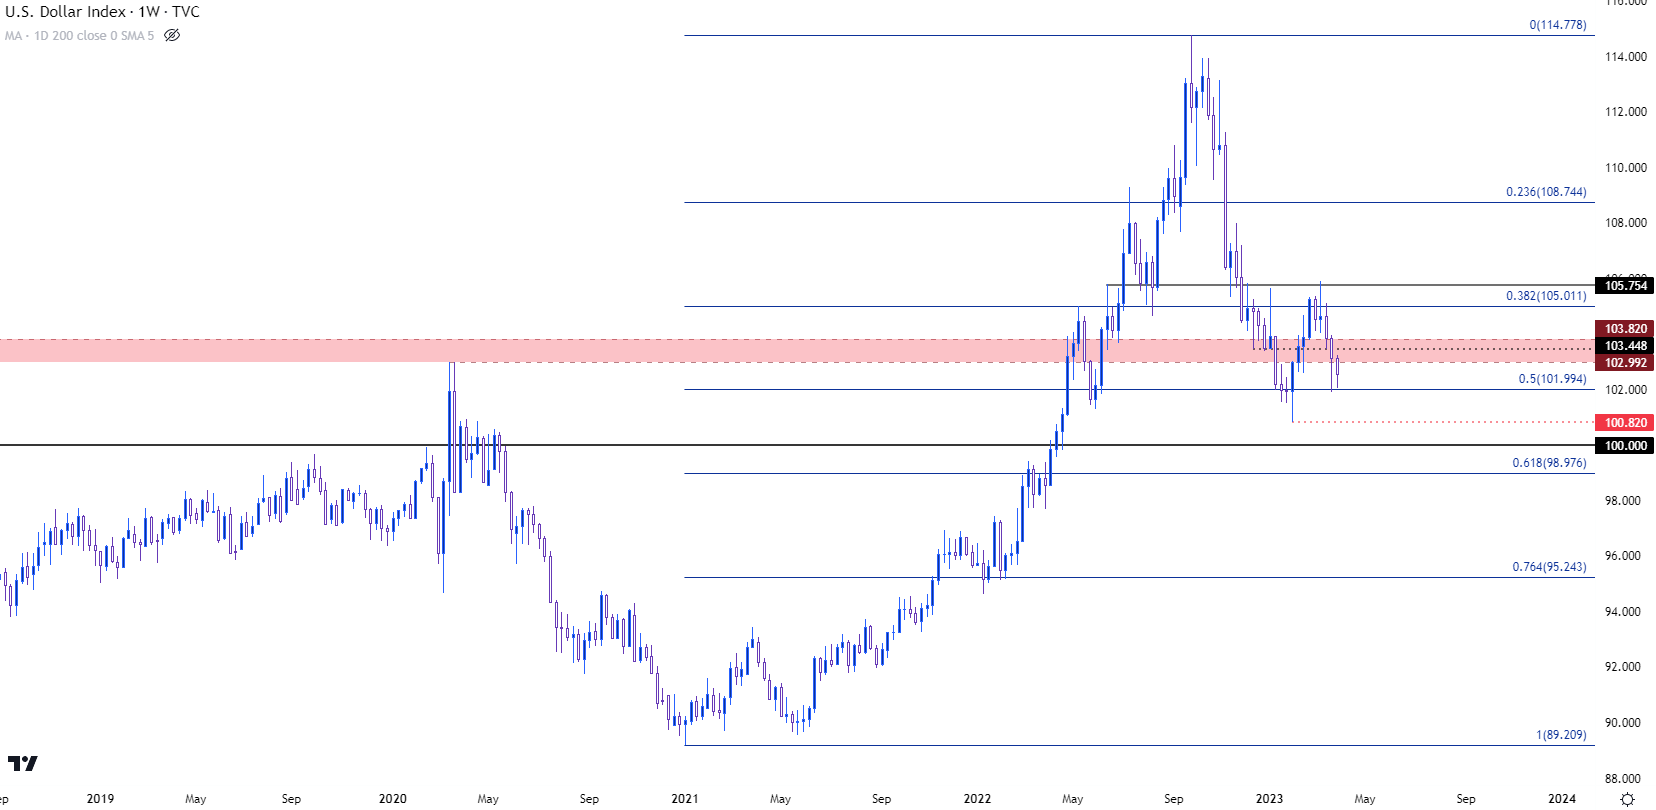
The US Dollar set a low of 100.82 in early-February but, after that, there was a hold at the 102 level, which is the 50% retracement of the 2021-2022 major move. That remains a key price as it was back in-play the week after. Below 103.82, we have a couple of notable psychological levels at 100 and then 99, the latter of which is confluent with the 61.8% retracement of the 2021-2022 major move.
Sitting above price action is a key zone with some longer-term interest, as the 103.00 level that was the swing-high in 2020 and the 103.82 level that was the swing high in 2017 were both in-play during Q1. Above that, the 105 level is of note as this is the 38.2% retracement of that same Fibonacci retracement, which is followed by 105.75, which helped to set the high for last quarter at an area of support-turned-resistance.
US Dollar - DXY Daily Price Chart (indicative only, not available on Forex.com platforms)

Chart prepared by James Stanley; data derived from Tradingview
EUR/USD
The Euro came into 2023 with a full head of steam. The pair was punished for the first nine months of last year as the Fed was hiking but the ECB was holding. Inflation in Europe continued to climb and the ECB finally started to shift in late-September, which led to a really strong Q4 of price action in the pair as rates markets started to price in hikes from the European Central Bank.
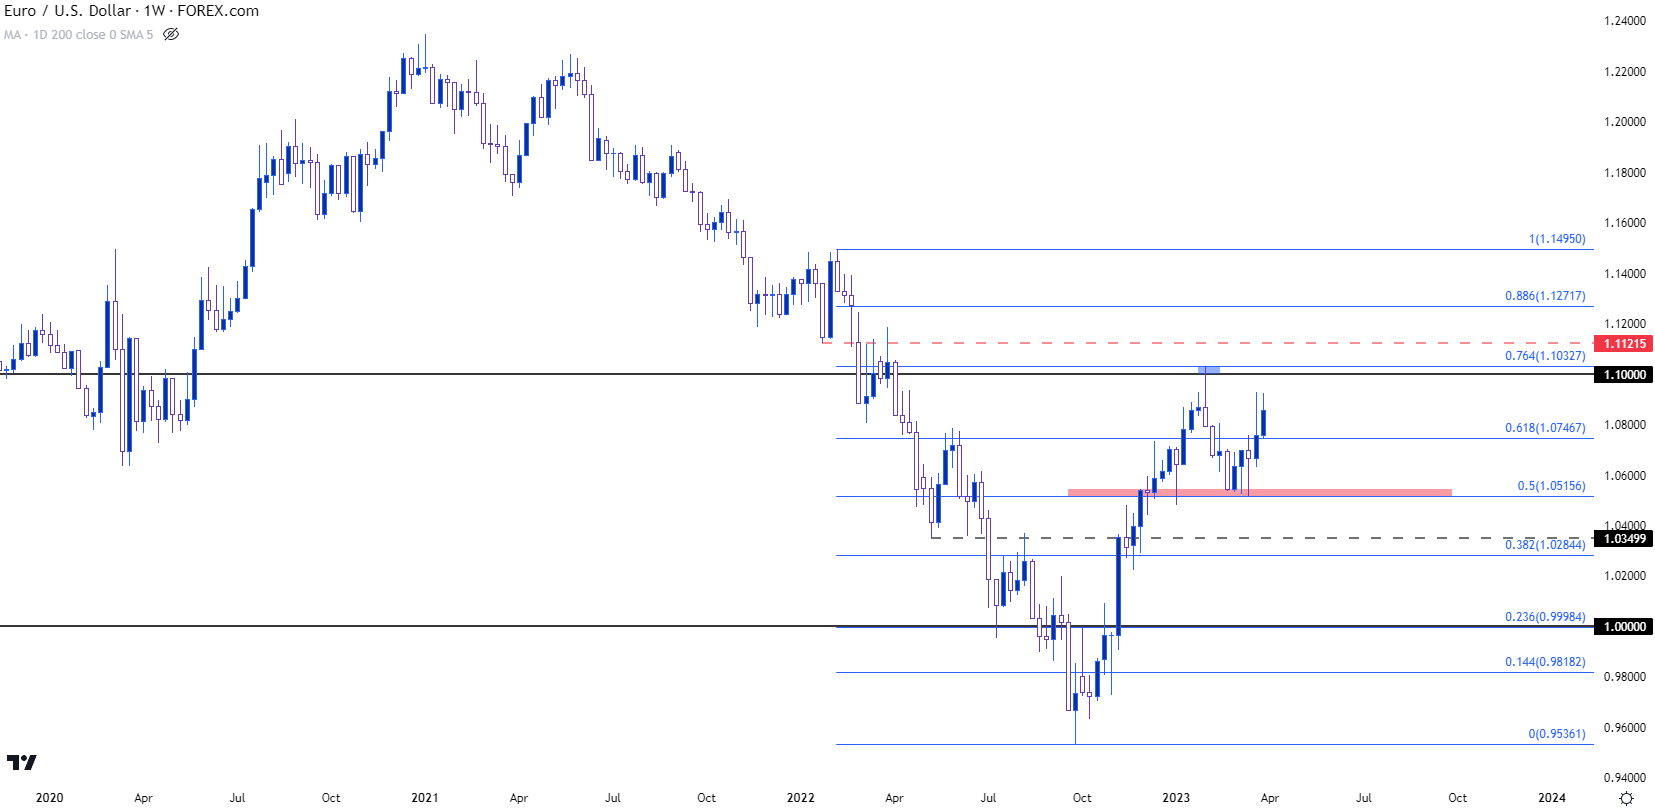
While it was a rocky first week of 2023, EUR/USD found support around the 1.0500 handle before a very bad services PMI report prodded another push of USD-weakness. That allowed EUR/USD to extend its bullish move, eventually finding resistance at 1.1033 in early-February. That’s right at the 76.4% Fibonacci retracement of the major move spanning from last February down to that September low and after that came into play, sellers drove for much of the next six weeks until another support level came into the picture.
It was around the March ECB rate decision that sellers took another shot at breaking-below the 1.0500 handle. But Lagarde retained a hawkish tone and this helped EUR/USD to hold support, and Powell didn’t match that hawkishness a week later which has allowed for EUR/USD bulls to continue to push back towards the 1.1000 handle on the chart.
From the weekly chart below, we can see four consecutive weeks of support playing-in just above the 1.0500 handle, which suggests that the big picture bearish trend may not be ready yet – and this seems to match the fundamental backdrop at the moment. The big question is whether EUR/USD bulls can put forward much drive above the 1.1000 psychological level. We can see from the reversal candle in early-February and last week’s candle in late-March how there’s been a tendency for bulls to relent at or around the big figure. If buyers can force a break, the 1.1200 area remains of interest for follow-through resistance potential.
Near-term support is around the 1.0750 psychological level, which is the 61.8% retracement of that same Fibonacci study – and if sellers can elicit a breach of the 1.0500 handle at some point, the door begins to open to a re-test of 1.0350 and then 1.0200.
EUR/USD Weekly Price Chart

Chart prepared by James Stanley, EUR/USD on Tradingview
GBP/USD
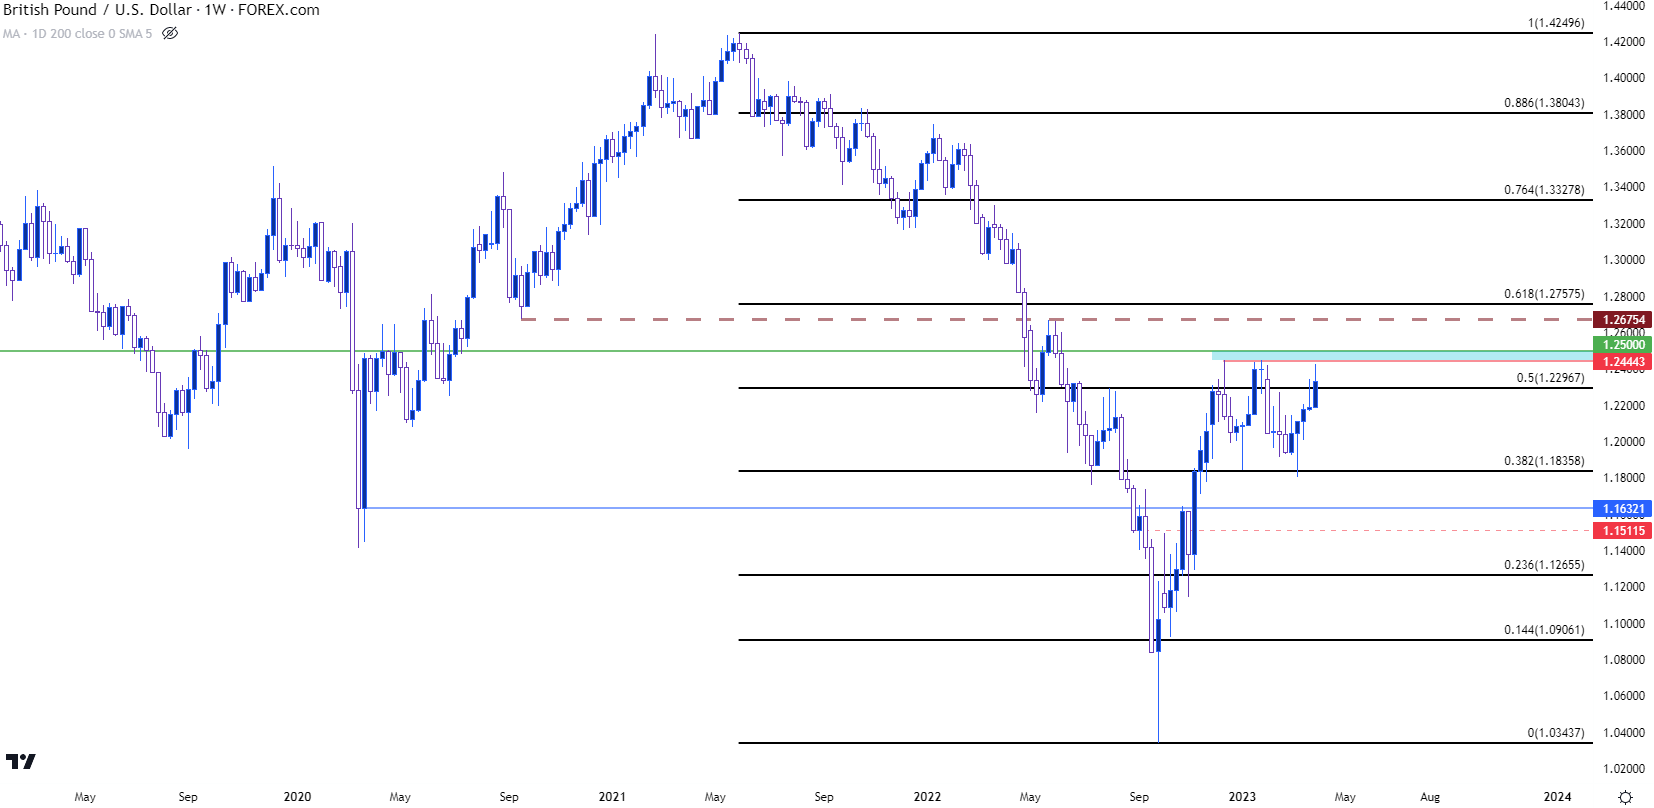
Cable spent the entirety of Q1 in a range. There was threat of a breakdown in early-March, but that’s around the time that Silicon Valley Bank took over the headlines, which helped to bring on USD-weakness and that certainly seems to have played a role here.
Nonetheless, GBP/USD has been pushing higher towards range resistance which shows around the 1.2444 level. There’ve been two tests of that price going back to mid-December, and above that is the psychological level at 1.2500.
If bulls can force a breakout from the range in Q2, the next notable resistance level is at an area of support-turned-resistance plotted at 1.2675. On the bearish side of the coin, range support plots around 1.1835-1.1850, after which the 1.1633 level is of interest, followed by the 1.1500 psychological level.
GBP/USD Weekly Price Chart

Chart prepared by James Stanley, GBP/USD on Tradingview
USD/JPY
Despite the US Dollar’s net weakness in Q1 as illustrated by DXY, USD/JPY was up on the quarter. Of course, at least some of that was built on the hope that new BoJ Governor Kazuo Ueda retains some of the policies of his predecessor Haruhiko Kuroda. That remains an uncertain prospect at the moment, but another dynamic remains in the equation, as well, and that’s related to rates.
As US rates were lifting through last year, so was the carry on the long side of USD/JPY. The Bank of Japan kept rates pegged to the lower-bound as the Federal Reserve continued to hike and that growing rate divergence led to a strong bullish trend in USD/JPY as the carry trade dominated flows.
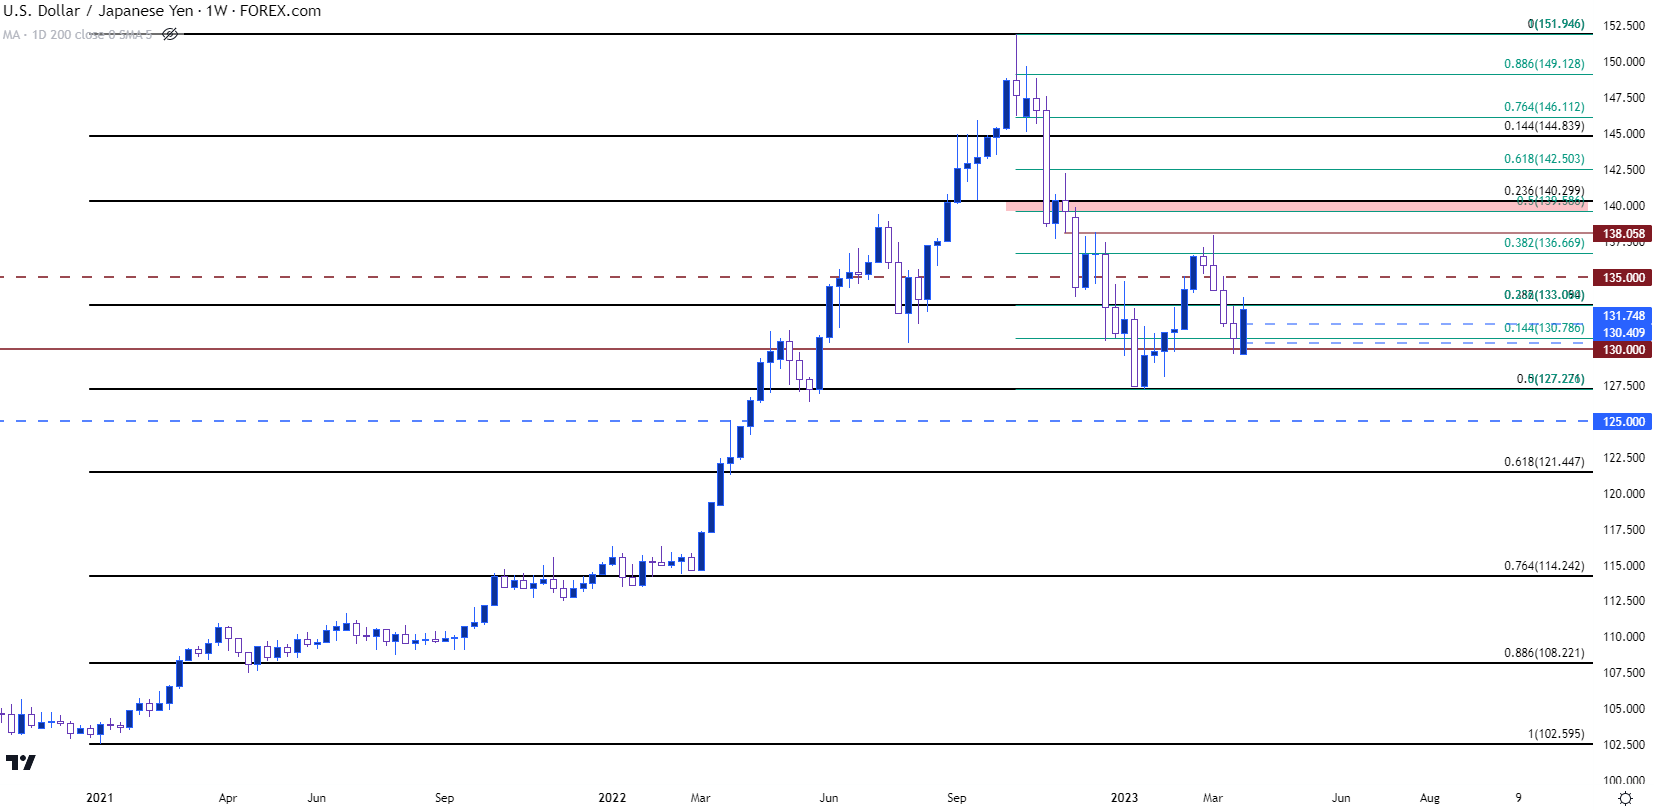
But it was around Q4 when rate expectations in the US began to move-lower and USD/JPY echoed that shift. It took USD/JPY 21 months to build a bullish trend – but only three months to erase half that trend, with support eventually showing at the 127.21 Fibonacci level in mid-January.
As USD strength came back online in February, USD/JPY rallied until resistance eventually showed up just below the 138.00 level, and sellers were in control for much of March until the 130 level came into the picture. The subsequent bounce from 130 has, so far, held at a key spot of confluent resistance around the 133.09 level, which is both the 38.2% retracement of the 2021-2022 bullish move, as well as the 23.6% retracement of the October-January sell-off. This week’s bar is currently showing as a non-completed bullish engulf which, if confirmed, points to bullish continuation potential as the door opens into Q2.
The big question here for next quarter is related to rates: If US rates continue to pullback, the fundamental push behind USD/JPY could remain as bearish as we see further unwind of the carry trade. There’s resistance potential at 135 and then around the 138.00 level. Below the 130 handle, that 127.21 spot sticks out, and if sellers can break through that, the fall could hasten as carry trade unwind would remain a factor in the equation. That opens the door for tests of 125 or perhaps even as deep as the Fibonacci level plotted around 121.50.
USD/JPY Weekly Price Chart

Chart prepared by James Stanley, USD/JPY on Tradingview
--- written by James Stanley, Senior Strategist
Follow James on Twitter @JStanleyFX


