EUR/GBP looks to a new Brexit deal
- New Brexit terms expected to be agreed today
- ECB’s Lane & BoE’s Broadbent to speak
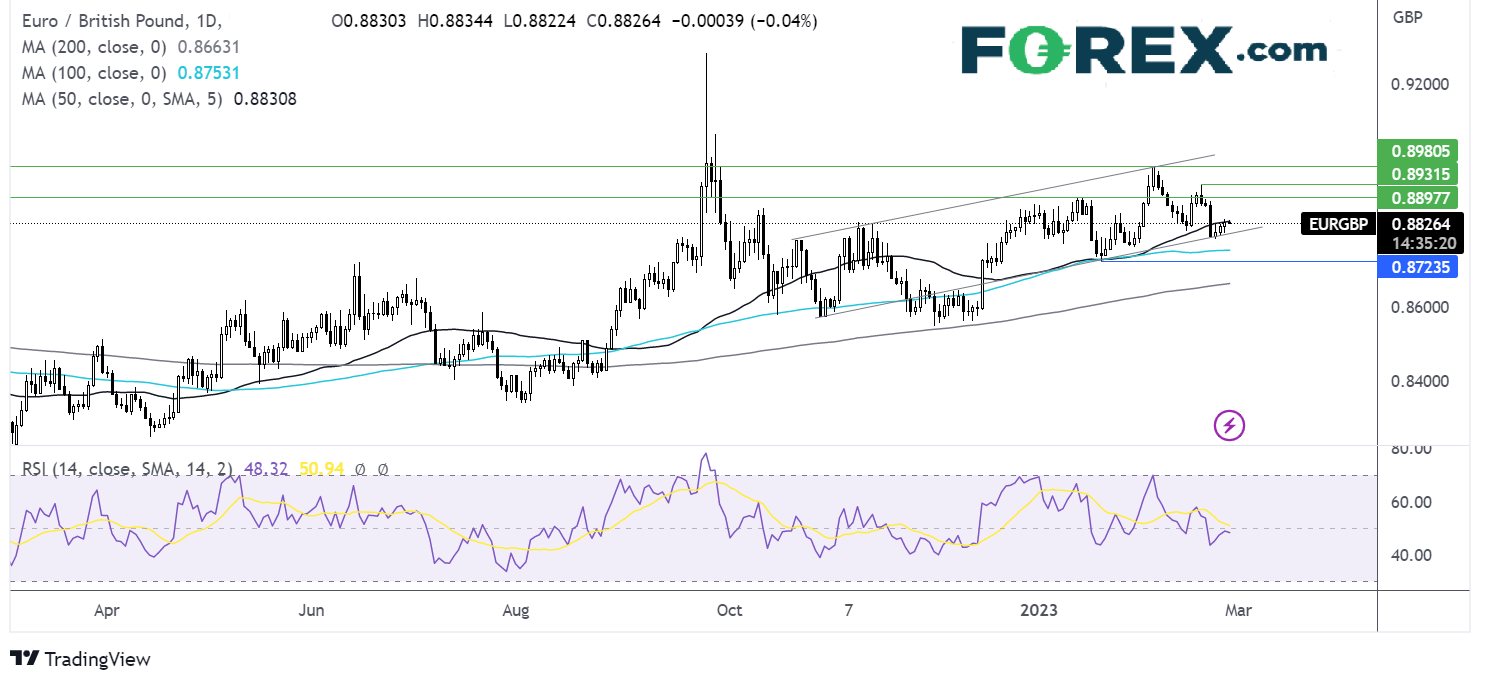
- EURGBP testing 50 sma resistance
EUR/GBP is holding steady after losses last week investors look ahead put a meeting between UK and EU leaders to finalise the Northern Ireland Brexit deal.
UK Prime Minister Rishi Sunak and EU president Ursula von der Leyen I expected to announce a new Brexit deal for Northern Ireland which seeks to resolve tensions caused by the 2020 post-Brexit arrangements. It remains to be seen whether the deal will go far enough to end the political deadlock in Northern Ireland whilst also satisfying critics in Britain.
Rishi Sunak is keen to ensure that any deal will resolve issues surrounding trade flows within the whole of the UK, safeguarding Northern Ireland’s place in the union.
While, the UK economic calendar is quiet, and traders will be the king player years end consumer confidence which is expected to confirm the preliminary reading of -19, up from -20.7 in January.
ECB’S Philip Lane and BoE’s Ben Broadbent are also due to speak later.
Looking out across the week, eurozone inflation data will be under the spotlight after core inflation unexpectedly ticked higher in January to 5.3% YoY. The minutes to the February ECB meeting are also set to be released.
Where next for EUR/GBP?
After finding support again on the rising trendline dating back to late October, EUR/GBP is testing the 50 sma at 0.8830. A rise above here is needed to attack the 0.89 the January high and 0.8920 the February 17 high. A rise above here creates a higher high.
Should the sellers successfully defend the 50 sma and break below the rising trendline support at 0.88 then the 100 sma at 0.8750 could offer some support. A break below here opens the door to 0.8720 the 2023 low.

Gold falls ahead of US durable goods orders
- Gold fell to 2023 low on Fed rate hike worries
- US durable goods data due
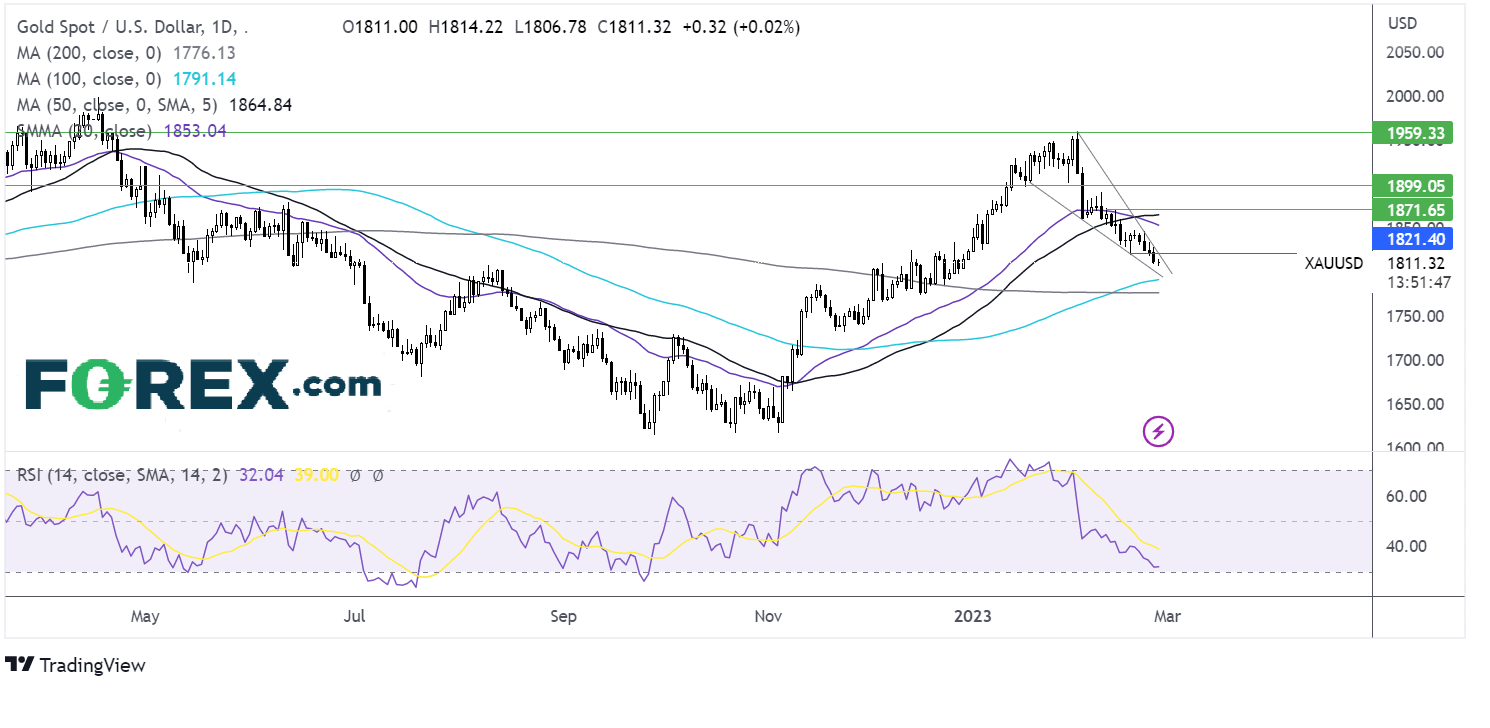
- Gold trades in a falling wedge
Gold is falling extending losses from last week. The precious metal dropped last week after core PCE, the Fed’s preferred gauge for inflation, unexpectedly ticked higher to 4.7% up from an upwardly revised 4.6%, also well above the expected 4.3% level.
The data comes after a series of stronger-than-forecast US data prints suggest that the UK economy is more resilient than initially expected and the Fed will need to raise interest rates higher for longer, boosting the USD and pressurising USD-denominated non-yielding gold.
Today attention is on US durable goods and pending home sales which could provide further clues about the health of the US economy. Stronger than forecast data could hurt demand for gold further.
Meanwhile, escalating geopolitical tensions between China and the US could support Gold
Where next for Gold prices?
Gold trades within a falling wedge, falling below the 20 and 50 sma and as the 20 crossed below the 50 sma in a bearish signal. The RSI also supports further downside.
Support can be seen at 1809, last week’s low, and 1800, the round number. A break below here opens the door to 1795, the falling trendline support, and 1790 the 100 sma.
On the flip side, a rise above 1820 could fuel bets of a break out on the upside of the falling wedge, bringing last week’s high of 1847 into focus and exposing the 20sma at 1853.


