200 Day Moving Average Summary
The 200 Day Moving Average is a popular indicator commonly referenced in financial analysis and can be used to help identify and grade trends in markets. This indicator can take on a utilitarian function as it can also help with support and resistance; or it can be coupled with another moving average to help read momentum which leads to items like the ‘death cross’ or the ‘golden cross.’ This article focuses on one of the common primary uses of the indicator in identifying and grading trends.
Trading Education:
This is a trading education article and in the interest of helping as many traders as possible, we’ve added a series of videos to accentuate a few key learning points below. Rather than explaining support/resistance or trends which is key for new(er) traders to understand, we’ve incorporated a video that will explain the concept with visuals. These have been mixed through the following text, and if you’re already comfortable with that subject matter you can simply scroll down to the next section to continue the topic.
The 200 Day Moving Average and Why It Matters
The future remains uncertain at all points in time. I know, this is an obvious statement, but for an article that delves into the topic of trading education and the analysis behind coming up with trade ideas, it’s an important point to drive home before we get started.
Fundamental analysis focuses on inputs that can impact future economic direction, and this can manifest itself in price movements given how that data is incorporated into the market. Technical analysis, on the other hand, is almost entirely looking at the past with some element of projection for the future. A chart is merely a record of where price has traded and as we should all already know; the past does not predict the future.
Things change. That’s just the nature of life and really, it’s what makes it interesting and exciting, even if unpredictable. And as traders it’s an unavoidable truth that must be encountered.
This is an important tenet of market analysis because of the two primary fields that we’ve just touched on, that’s the bulk of what traders have available to base decisions on: Either attempt to project the future based on some variable that may, possibly bring impact to market prices, like inflation or employment data. Or concentrate on the past in effort of getting the clearest picture of how price got to where it is, and from there, a projection can be made for where it may go next. The problem here is that while fundamental analysis is rooted in projections for the future and technical analysis is based on observations from the past, we live in the present, and that’s where our trades can get stopped out; so, as speculators some type of modulation or adjustment must happen to allow that analysis to produce consistent trade ideas.
In practice many traders use both in some form because neither is perfect. Failure will be a constant as no trader can sustain a 100% win rate and learning to control the impact of that failure will be a large sticking point in many traders’ careers. Because, after all, the one thing that can be guaranteed to the trader is that there will be times when they must take a loss. And if that one loss wipes away the gain from ten winners or, perhaps worse, destroys that trader’s confidence, the problem from that single item of failure can have large repercussions. This points to the importance or perhaps even the necessity of risk management.
This isn’t to say that analysis is pointless. It certainly has a role, but traders should go into it knowing that it’s just a part of the equation and not a panacea on the pathway to becoming Nostradamus. Traders need a plan, and that plan should include more than just entry or analytical criteria.
If we break down technical analysis there’s really two separate items of value that the trader can derive which can help. The first is somewhat obvious as support and resistance, as this is going to be a key component that can help in setting stops and limits. This speaks to the very core of risk management as a trader looking to get long probably wouldn’t want to get too aggressive if price is holding at resistance. Support, on the other hand, could be more enticing because that bullish trader now has a place on the chart where they can test their theory. A stop can be placed at some point below that support so that the trader can institute simple if-then logic: ‘If the market breaks down below support, my bullish thesis is no longer valid, and at that point, I want to stop the bleeding to contain the damage from the losing trade.’
This can be valuable information for the trader and support and resistance can also be incorporated into market analysis: If you’re the trader in the above scenario and you’re bullish, but price is currently breaking down below support to establish fresh lows, is that really the best time to impose that bullish bias? Or should the trader take a step back and wait until there’s some manifestation of strength in the market with which they can attempt to attach themselves to? This would require a hold of support, and some element of defense from bulls at those key junctures which could further indicate bullish continuation potential.
Video - What is Support?
The Allure of Trends
Support and resistance are important for a number of reasons, particularly risk management. But for finding directional moves, traders can seek out trending environments in effort of aligning with whatever bias the market has been showing.
While the future does remain uncertain, trends do take place, and there can be a number of reasons for that. If it was an Electric Vehicle stock in 2021, that reason was fairly obvious as there was hope driven by massive government support going into ‘green initiatives.’ Or if it was a company with exposure to Artificial Intelligence in 2023, there was a reason for that, too, as excitement was bristling after the unveil of Chat GPT and there was a rush of buyers in those companies, helping to build strong bullish trends – which then attracted other market participants whose demand further drove that move.
Of course, trends don’t always go up, there’s down trends, too, and this was the case for the Nasdaq in the first ten months of 2022 as the world adjusted to the Federal Reserve’s interest rate hikes. Or, perhaps we can look at USD/JPY in Q4 of 2022, going along with that interest rate dynamic as a strong carry trade that took 21 months to build saw 50% of the move wiped out in three short months. And then after support appeared at the half-way point of that prior trend in early-2023, bulls returned and pushed the trend right back to where it was the year before.
Trends can happen for any number of reasons and the rationale behind them is what often gets the news headlines. But, for the trader, the ‘why’ is much less important than the ‘what,’ and the what is a bias that’s been observed in the marketplace that can be incorporated into the trader’s strategy.
Again, we have to dial back to the very first sentence of this article: The future remains uncertain. But a trend allows a trader to take the recently observed bias and this can help to inform the trader of which direction may be the most beneficial to work with given that observation.
Video - Trading the Trend
The Trend is Your Friend
‘The trend is your friend’ is a common saying in markets and this speaks directly to that factor of bias noted above. While the future does remain uncertain the bias observed in a trend can, potentially, help the trader to get the probabilities on their side. Of course, there are no guarantees, trends can reverse and not every theme will show a constant strain of pressure in the trend-side direction. But, again, failure will happen at points and that’s where risk management comes into the picture.
But when the trend does continue the trader can find themselves in an attractive position, where the upside potential can be factors of what their initial risk outlay was. This begins to speak to risk management again as traders can use trending environments to look for risk-reward ratios of 1:2, 1:3, 1:4 or perhaps even higher. And it’s that greater benefit that can be had when right, when trends do continue, that helps to offset the losses from when failure must be faced.
If a trader places ten trades but only wins on 40%, which would mean four wins and six losses, a 1:2 risk-reward ratio can still allow for profitability. The four wins would have $2 each, for a total of $8. But the six losses would come with a $1 loss each, for a total of $6 lost. The net would be $2 at a 40% win rate and if that trader was able to win 50% of the time, the profit factor would be even more attractive with a net of $5.
While this math may sound like we’ve veered away from trends, we haven’t: This is rationale for why traders can be attracted to trending market environments, the prospect of continuation and greater profit potential beyond even what current price action structure indicates. It’s also a more salient way of looking at trading, rather than leaning on analysis to ‘try to outguess’ the market 70 or 80% of the time, which is probably impractical unless poor risk management is being used which can have a damaging effect on the trader’s account, even if they’re winning 70 or 80% of the time.
Identifying Trends
Among market prognosticators you will find a plethora of trend spotting techniques, and this can be diagnosed on a number of timeframes or other relative basis. After all, ‘trend’ itself isn’t really an objective metric, is it? If I ask you about the trend in EUR/USD any response other than another question would probably be incorrect to some degree. Are you referring to the trend on the weekly chart or the five-minute chart? Both can be valid answers to the question, but neither will technically be correct, so before we proceed we must first identify some parameters.
One of the more common mechanism for diagnosing trends is the moving average. It’s a rather simple indicator and often one of the first that’s learned by traders. It is not predictive, but that’s no different than any other technical indicator based on the past as it’s merely a way of simplifying or condensing what’s already happened. But – the fact that prices are moving above an average can be a notable item in regards to that market’s behavior, and this can be a step towards identifying and setting up trades on the basis of that trending dynamic.
Video - How to Use Moving Averages
The 200 Day Moving Average
The 200-period simple moving average applied to the daily chart is a very common method of trend identification. There are some reasons that many new traders will avoid or move away from this, however, and it’s likely due to its perceived slowness as an average of the last 200 periods will take some time and effort to make any significant movements higher or lower. If today’s daily candle registers a large gain, it’s still only 0.5% of the next day’s computation in the 200-day moving average. So, it can take some time before that newfound strength makes a marked impact on the indicator. But, that slowness or infrequency of crossover events can actually be considered as more of a ‘feature’ than a ‘bug.’
For the next few examples, I’m going to pick on EUR/USD using 2021-2023 price action. It’s important to note that this is anecdotal, and the reason that I’m using these examples is to illustrate how an indicator or strategy such as that around the 200-day moving average can be implemented into a trader’s approach. It’s critical to highlight the fact that this isn’t some ‘holy grail’ type of indicator but, rather, an analytical item that can produce value if properly integrated into a trader’s strategy.
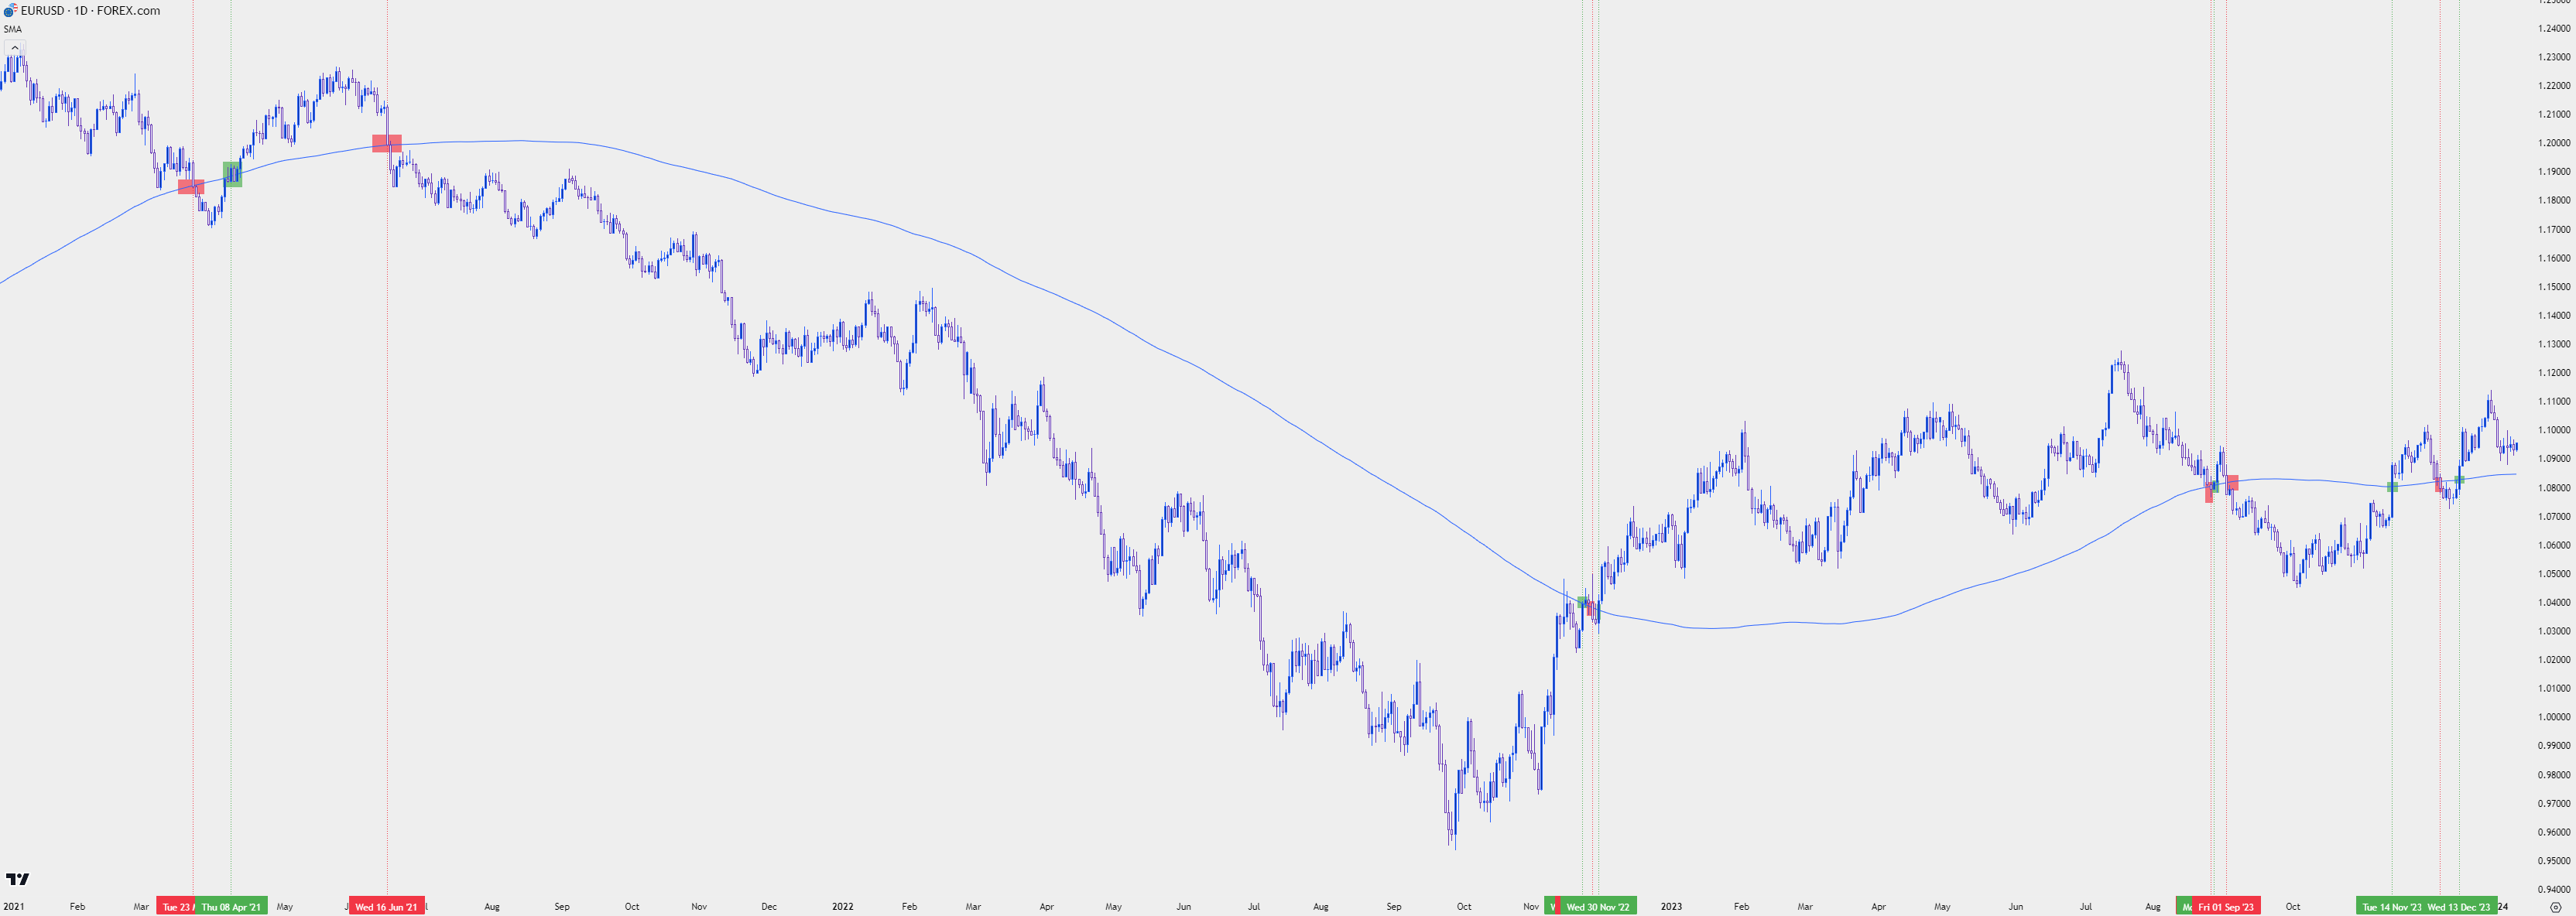
On the below chart of EUR/USD, we’re looking at daily candles since the beginning of 2021, with the 200-day moving average plotted. There were 12 separate crossover events, which I’m classifying as a daily close above or below the 200-day moving average to signal a possible trend change. Each has been appropriately marked with a red or green box, along with a vertical line on the chart on the day of each event.
EUR/USD Daily Chart – 200 DMA Applied, Crossovers Notated
 Chart prepared by James Stanley, EUR/USD on Tradingview, 2021- Jan 10, 2024
With more than two years of price history on the above chart and only 12 instances of a 200-day moving average crossover, the infrequency or slowness effect that I mentioned previously is graphically depicted. And to be sure, some of those crossover events did not continue in the trend-side direction; you’ll probably also notice from the above chart that there was a tendency for these events to be grouped around each other.
While not every crossover led to a prolonged trend, some did, and when it did the extension in those moves was significant. But it’s not perfect, and to illustrate we can take a look at one of the messier episodes that appeared in November of 2022 as there were three crossover events taking place within a week.
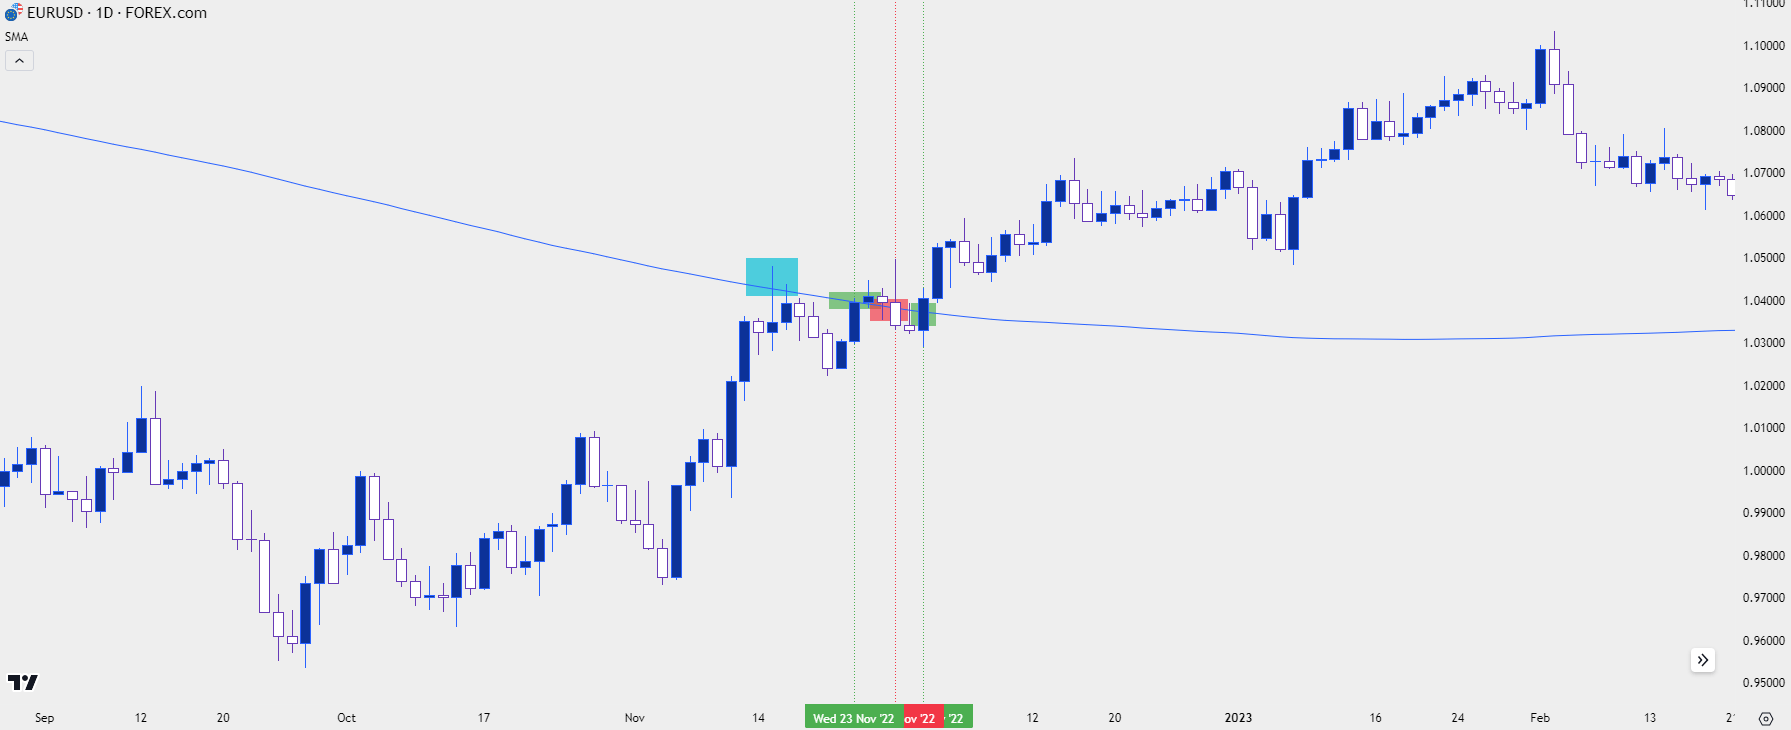
At the time bulls had already ramped price aggressively from the September lows, and the first instance of re-engagement with the 200-day moving average was in the middle of November when it came in to help set resistance. This is marked with a blue box on the below chart and notice how that resistance held for a week until buyers pushed for a re-test. It was on that re-test that price started to wedge above the moving average and on November 23rd, there was the first daily close above that level.
It couldn’t last, however, as there was a bearish crossover that showed a few days later, with resistance from the prior test at the 200-day moving average helping to hold the highs. The red box on the below chart indicates the bearish crossover and that was followed two days later by another bullish crossover (again, indicated in green).
The third crossover event led to a prolonged topside trend that continued through the first-half of 2023 trade and that would be the desired impact for the trend trader, finally catching an instance that leads into an extended trend scenario. It’s that extension that can allow for larger profit targets, which can help to offset smaller stop losses.
For instance, if the trader was entering the market after each crossover event, in the direction of the cross, and attaching a 1-to-2 risk-reward ratio, they could potentially be near break-even. The one win of $2 would be offset by the two losses of $1 each. There’s also slippage and trade costs to consider so in reality this trader might be looking at a net loss, but probably less of a loss than one would expect with a 33% win ratio.
If the trader was instead going into each trade with a 1:3 risk-reward ratio, well they would stand a chance of walking away with a net profit. The one winner at $3 would offset the two losses of $1 each, allowing for a net profit of $1 before trade costs are considered.
But, as you can see from the below scenario when the trend does extend, it can last for a while, and only taking out $3 from that move could be removing some potential from the trend trader that could, potentially, look for an even larger target.
EUR/USD Daily Chart – Crossover Investigation, November 2022
 Chart prepared by James Stanley, EUR/USD on Tradingview, (Sept, 2022 – February, 2023)
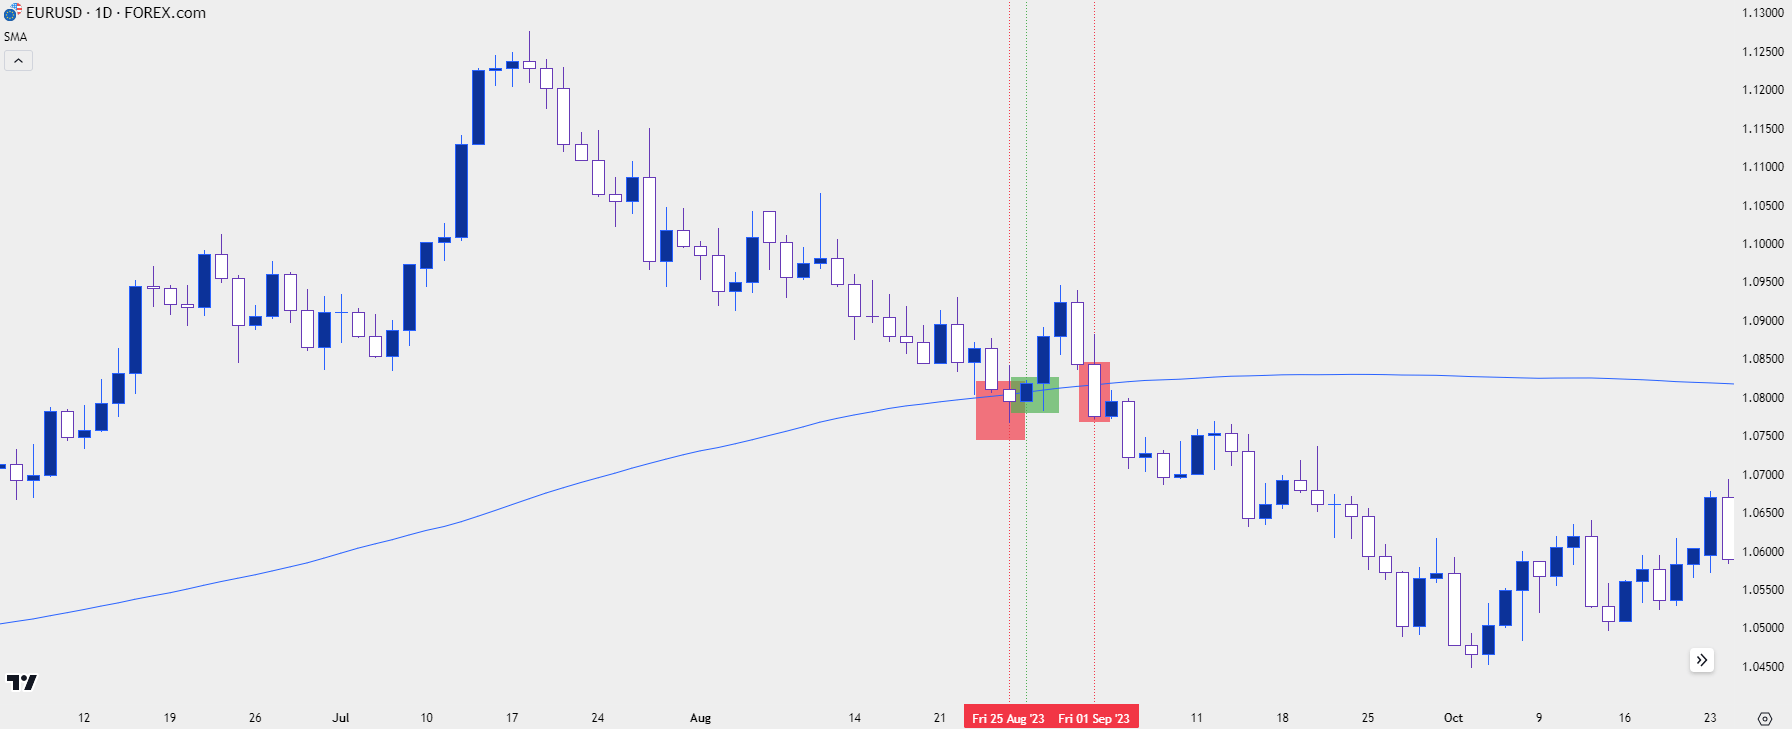
Let’s look at another example to further illustrate, and for that we can go to the next series of crossover events that showed in EUR/USD. This took place in August and September of 2023, and like the last episode the crossover itself was somewhat messy.
The first crossover was bearish but, on the same day of the crossover, price had set a low, and then pushed back above the 200-day moving average a day later. So that probably would’ve been a failed entry for the trend trader. The bullish crossover that showed right after did lead to run of as much as 130 pips, but that too failed to extend and prices quickly turned back around.
The third crossover event led to a prolonged trend as bears took more and more control, leading to a bearish move that ran for about a month after. Again, two events look as though they would’ve been a failure, while the third could have brought a large move. To the trader using a risk-reward ratio of 1:3 or higher, that could allow for profit potential as the trend finally took hold. But for the trader using a 1:1 or a 1:2 risk-reward ratio, they could’ve still faced a loss despite the extension in that third instance.
But – a key question here is whether or not the trader has to stop looking for bearish setups after that third instance, after their targets were hit? No – they have an observed bias and there’s a few different ways that they can move forward with that in mind.
EUR/USD Daily Chart – Crossover Investigation, August/September 2023
 Chart prepared by James Stanley, EUR/USD on Tradingview, (July, 2023 – October, 2023)
Trend Strategy
To this point, we’ve merely investigated the 200-day moving average crossover itself in the effort of keeping things simple. But – this can be extrapolated upon with even more strategy.
For instance, a trader can also incorporate a 50-day moving average and this can bring a few different uses. The 50-day moving average crossing the 200-day moving average is itself a notable event, often called the ‘golden cross’ when the 50 crosses above the 200, or the ‘death cross’ when the 50 period moving average crosses down and below the 200.
Or, alternatively, if the trader already has a bullish bias as given price’s stance with the 200DMA (price is above the 200DMA), they can then use price crossing above the 50-period moving average to investigate entry. This way, they’re ensuring that they’re on the side of the long-term trend, as highlighted by the 200DMA, but they’re also attempting to harness shorter-term momentum by looking for bullish crossovers of the 50-period moving average.
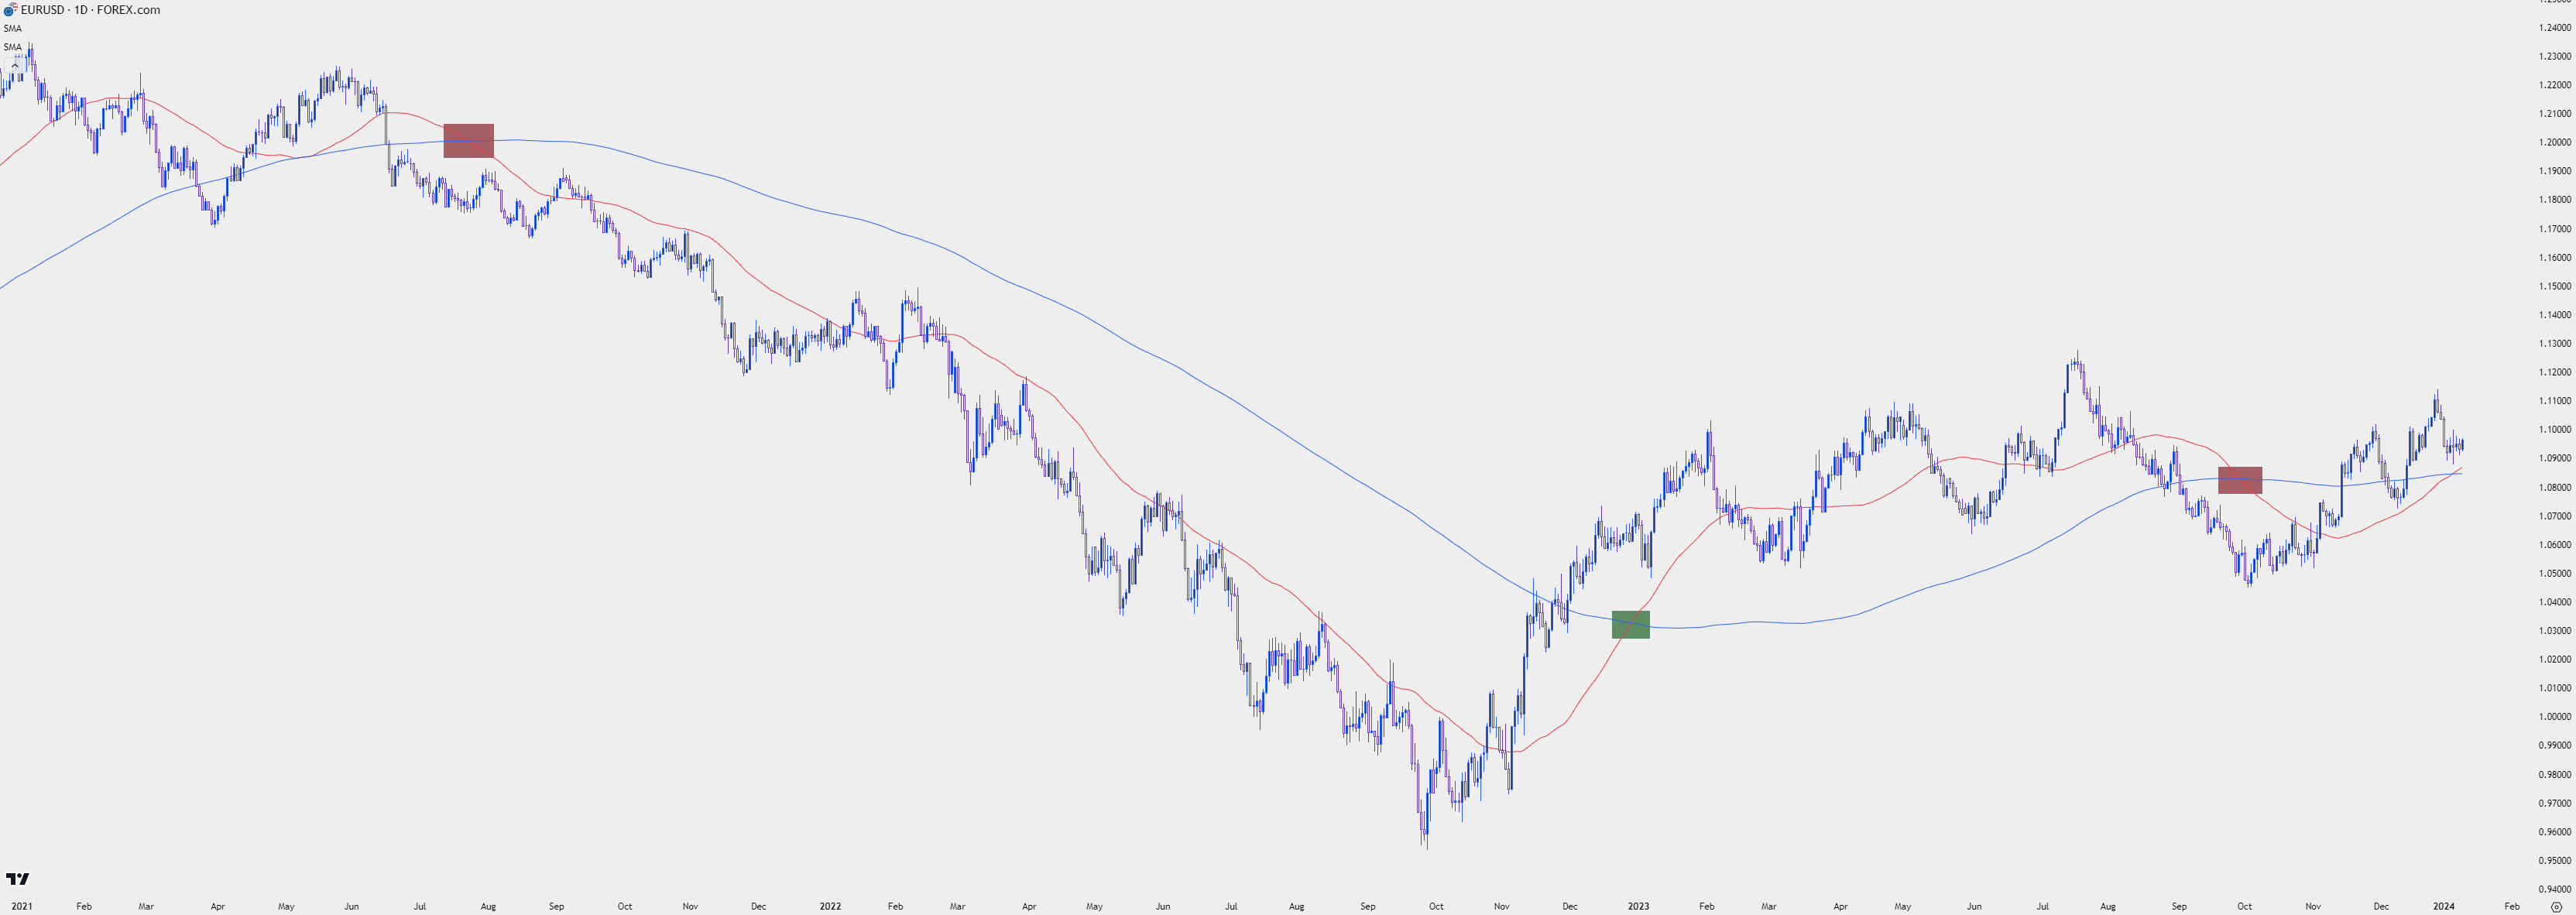
On the below chart, I’ve added the 50-day moving average to the same EUR/USD scenario we’ve been investigating. And notice that now there are only three crossover events. But, this chart also highlights the challenge with trading the golden or death cross, and that’s lag. While the first crossover led to an extended trend, the second crossover was so late that by the time the trader could’ve acted on it, price was already near the high. And for the third crossover event, the low was already in-place.
So while the lag produced by the additional indicator allowed for a cleaner read and fewer instances (as opposed to using price with the 200DMA), it really only brought benefit in those cases of extremely extended trends.
EUR/USD Daily Chart - 50, 200 Day Moving Averages Applied
 Chart prepared by James Stanley, EUR/USD on Tradingview, 2021- Jan 10, 2024
But – implementing the 50-day moving average as an entry tool, when taken in consideration of the trend bias as produced by the 200-day moving average, could allow for more frequent crossover events in the trend-side direction.
This will be explored in greater detail in a future article when we continue the discussion on moving averages and strategy architecture.
Frequently Asked Questions
Is the 3rd Time Always the Charm with 200DMA Crossovers?
Given our first two examples I wanted to address this point, as both seemed to show two failed crossovers before a third that led into an extended trend.
And the answer to the question is ‘no,’ the third time is not always the crossover that leads to a trend. This can happen on the first, second, fourth, or fifth: Again, the future remains uncertain and the entire point here is to illustrate the trending environments that can show after one of these crossovers. But, perhaps more to the point, it illustrates the importance of items that are necessary for a trader to address, namely, the fact that failure is always a possibility and that those are the situations that must be mitigated to allow for benefit when failure isn’t the outcome. As the old saying goes, ‘cut the losers short, and let the winners run.’
How Can the 200-day Moving Average Fit with a Fundamental-Focused Trader?
Something like the 200-day moving average can be a strong fit for the trader that wants to focus more heavily on fundamental analysis. It’s simple, in that it can easily be applied to almost any charting package with a minimum of trouble, and it’s always graphically depicted as the average over the past 200 periods. So, in a vacuum, a trader can read just how strong or elongated a trend is by how far away price is from the moving average and if a crossover is nearing, then there’s a potential trend shift that may be taking place.
But key for the fundamental trader is some element of balance and this can be had with simple technical tools, to ensure that their analysis is on the same page as the market and not driven entirely by forward-looking projections (or hope). Let’s take, for instance, the first crossover event that we investigated above in November of 2022 in EUR/USD. That showed up after a strong and extended bearish trend dominated in the pair for more than a year. After the bearish crossover in June of 2021 when EUR/USD was breaking below the 1.2000 level, there wasn’t another crossover until November of 2023, as we saw above.
EUR/USD was trading around 1.0400 when bulls were attempting to push price back above the indicator; but key for that theme was the strength that had shown before and this was very much driven by a fundamental driver. At the time, rate expectations were falling in the US as inflation had begun to recede. Meanwhile, rate hike bets were increasing around Europe as inflation remained strong and the ECB had told markets that they were going to get more-hawkish. So there was a strong fundamental push of strength at the time, and for the fundamental trader, the crossover above the 200-day moving average in November, which took a couple of weeks, could’ve been recognition of that fact, allowing for bullish potential.
This could even allow the fundamental-heavy trader to ignore the bearish crossover, as it didn’t fit their fundamental outlook; and instead, they could focus on the bullish crossover event that confirmed their fundamental bias.
There are numerous ways that a fundamental analysis-heavy approach can incorporate a simple technical item, like the 200-day moving average, in effort of making their strategy more effective.
Video - What is Fundamental Analysis?
--- written by James Stanley, Senior Strategist
Follow James on Twitter/X at @JStanleyFX


