S&P 500 Talking Points:
- Yesterday saw the 5666 level come into play but similar to the prior week, bulls were unable to do much beyond resistance.
- That resistance did lead to a pullback last week ahead of the Jackson Hole speech from Jerome Powell, but support held at 5888 and price pushed right back to resistance. This illustrates a near-term range that’s built in the S&P 500.
- I’ll be looking into these setups in the Tuesday webinar and you’re welcome to join, click here for registration information.
Last Tuesday marked the end of the consecutive-gains streak in S&P 500 Futures, and since then, the name of the game has been grind and churn. Resistance has been a bit better defined around the 5562.75-5666 zone which has now held a couple of different inflections. The first reaction to that resistance did produce a pullback last week ahead of the Friday speech at Jackson Hole from Jerome Powell, but support held around the 5588 level and bulls went right back up to technically set a fresh high on the continuation of that movement into the open of this week.
But, like we saw last Thursday morning, that’s when bulls began to calm and prices have since pulled back; and once again the 5631.75 level is back in-play.
S&P 500 Futures 30-Minute Chart
 Chart prepared by James Stanley; data derived from Tradingview
S&P 500 Bigger Picture
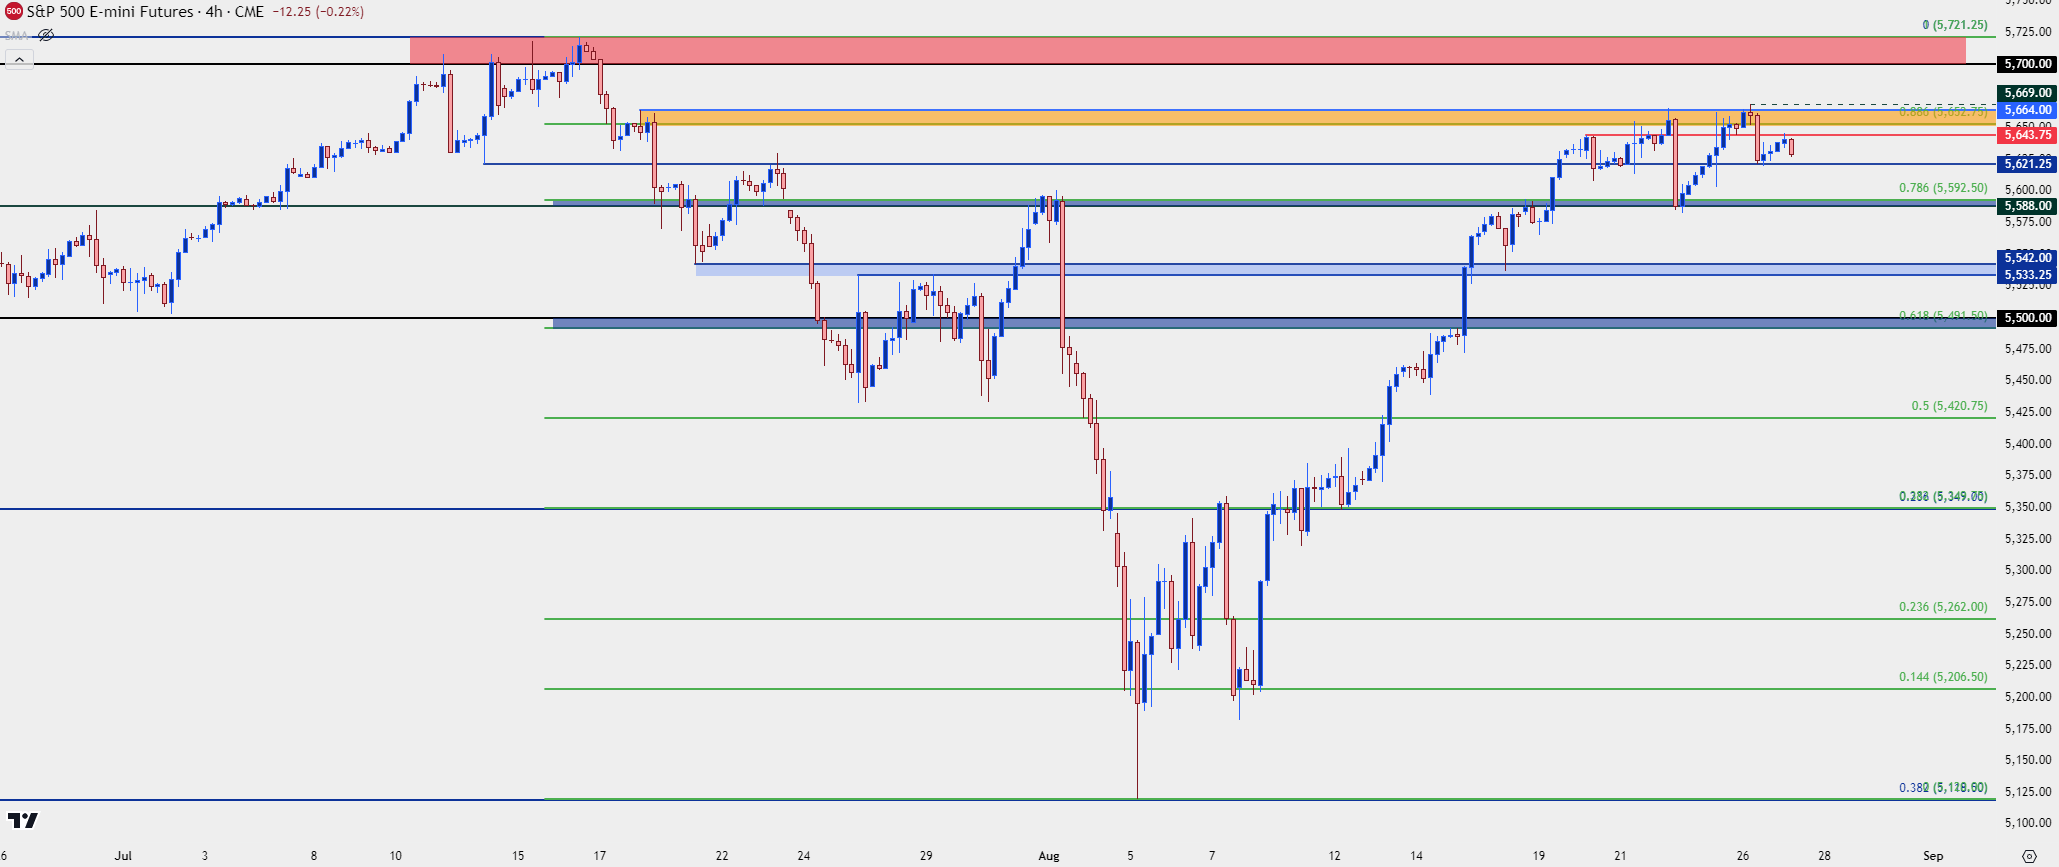
Taking a step back we essentially have a short-term, week-long range after an aggressively bullish move; with the stall showing just inside of a test of the all-time-highs. Those ATHs were themselves a zone of stall before the sell-off took over and interestingly, this happened in the week after the BoJ had intervened.
This is the type of backdrop where a larger pullback could appear yet the intermediate-term trend could retain a bullish appeal. Much like we saw at 5588 last week, bulls can make a strong reaction to a key level of support if it does come into play. The key for that would be buyers not allowing too much damage to happen, or else this is going to take on more of a tone of reversal.
The support from last week remains key at 5588, and for shorter-term support, there’s the 5621.25 swing that helped to set the low yesterday. Below 5588 is another zone of interest, from 5533.25-5542. If sellers can take that out, the next support would be the zone around 5k and I’m considering that a major decision point for the market – a drop below that would bring on bearish reversal themes.
For resistance, the 5666 zone is very clear but before that, we have 5643.75 which helped to hold the overnight high. And above 5666 is the 5700 zone, running up to the ATH of 5721.25.
Support:
S1: 5621.25
S2: 5588-5592.50
S3: 5533.25-5542
S4: 5491.50-5500
Resistance:
R1: 5643.75
R2: 5652.75-5666
R3: 5700-5721.50
S&P 500 Four-Hour Price Chart
 Chart prepared by James Stanley; data derived from Tradingview
--- written by James Stanley, Senior Strategist


