S&P 500 Talking Points:
- Despite the Powell proclamation of pivot last Friday, U.S. equities have been unable to prod a bullish move with prices remaining in the same range that’s been in-play over the past week.
- The big driver for equities this week is unveiled after the closing bell today with NVDA earnings and NVDA equity has shown a similar range over the past week as the S&P 500 has continued to churn.
- I’ll be looking into these setups in the Tuesday webinar and you’re welcome to join, click here for registration information.
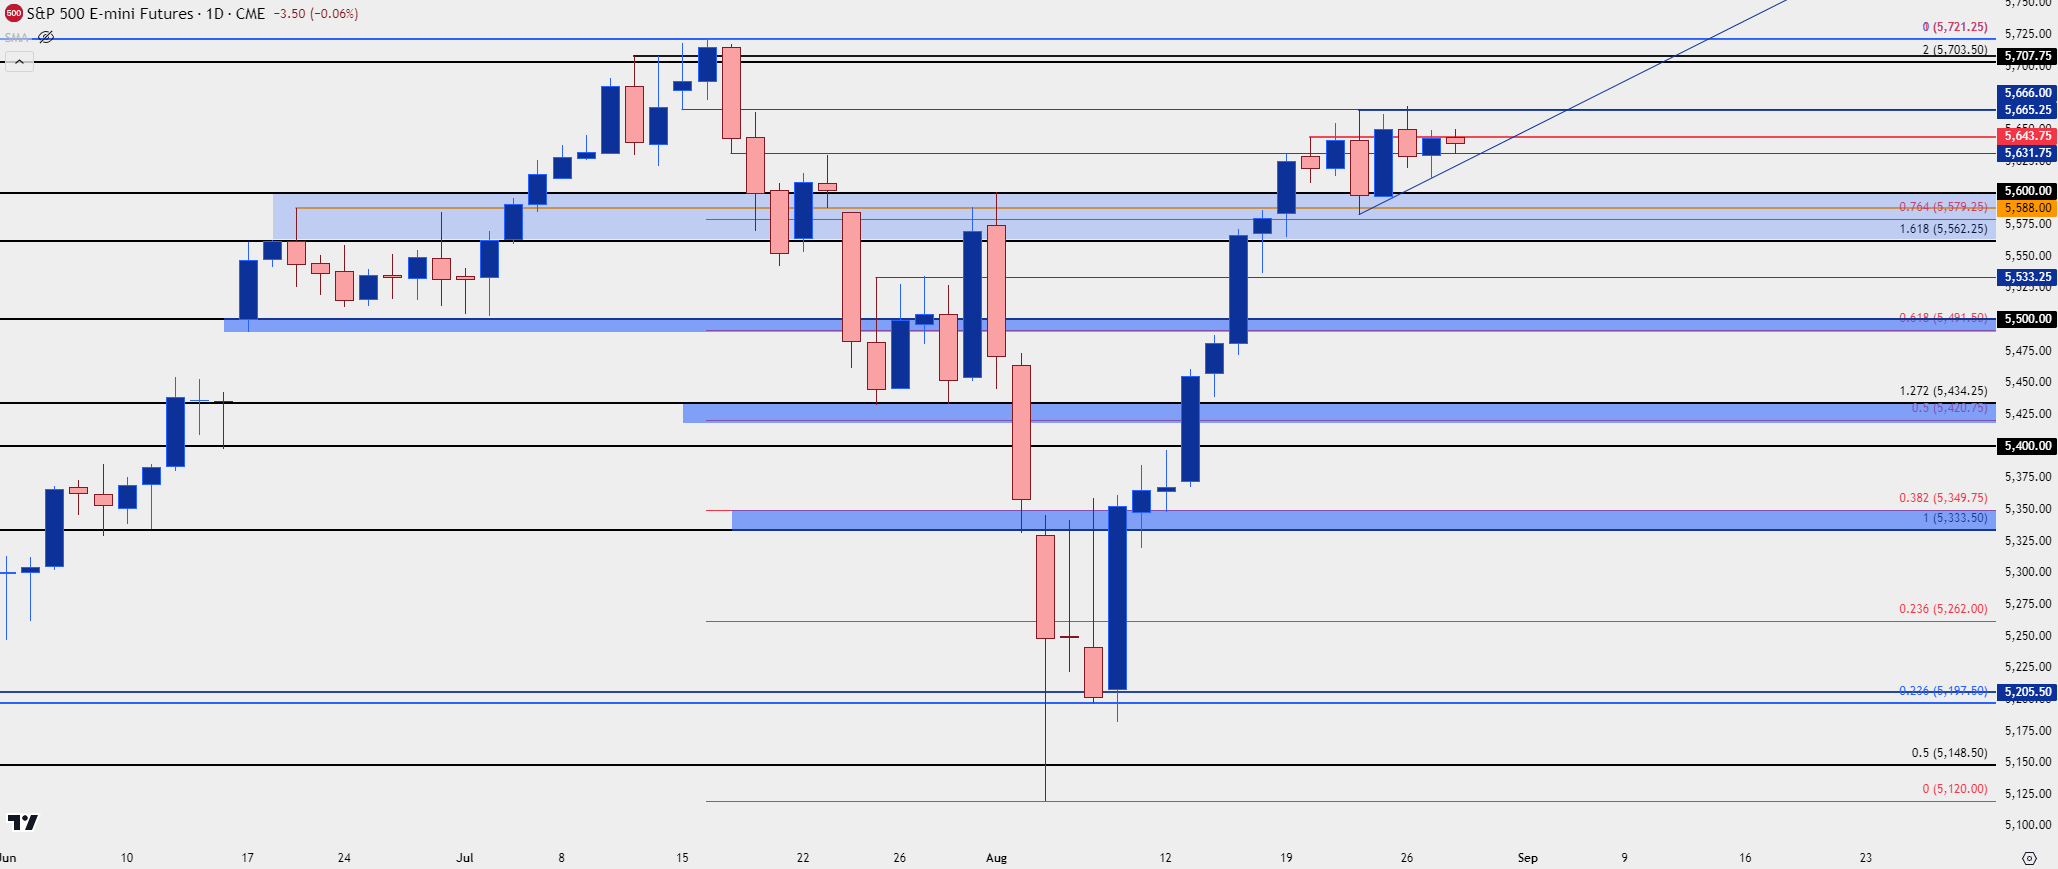
Stocks have continued to churn over the past week, holding within a relatively tight range for S&P 500 futures even with the Powell pivot at Jackson Hole last Friday. Last Thursday saw a bearish engulf print ahead of that announcement, and the day after the entirety of the prior day’s move retraced. A recovery of that nature would normally give bulls the ability to push a resistance test, but in this case, the 5666 level held the highs and prices recoiled back into the range.
Yesterday saw another attempt at a pullback but bulls showed up at a higher-low to push right back to 5643 resistance. And the familiar level of 5631.75 has acted as support so far this morning, which could construe a slightly bullish bias at this point from that ranging price action.
S&P 500 Daily Price Chart
 Chart prepared by James Stanley; data derived from Tradingview
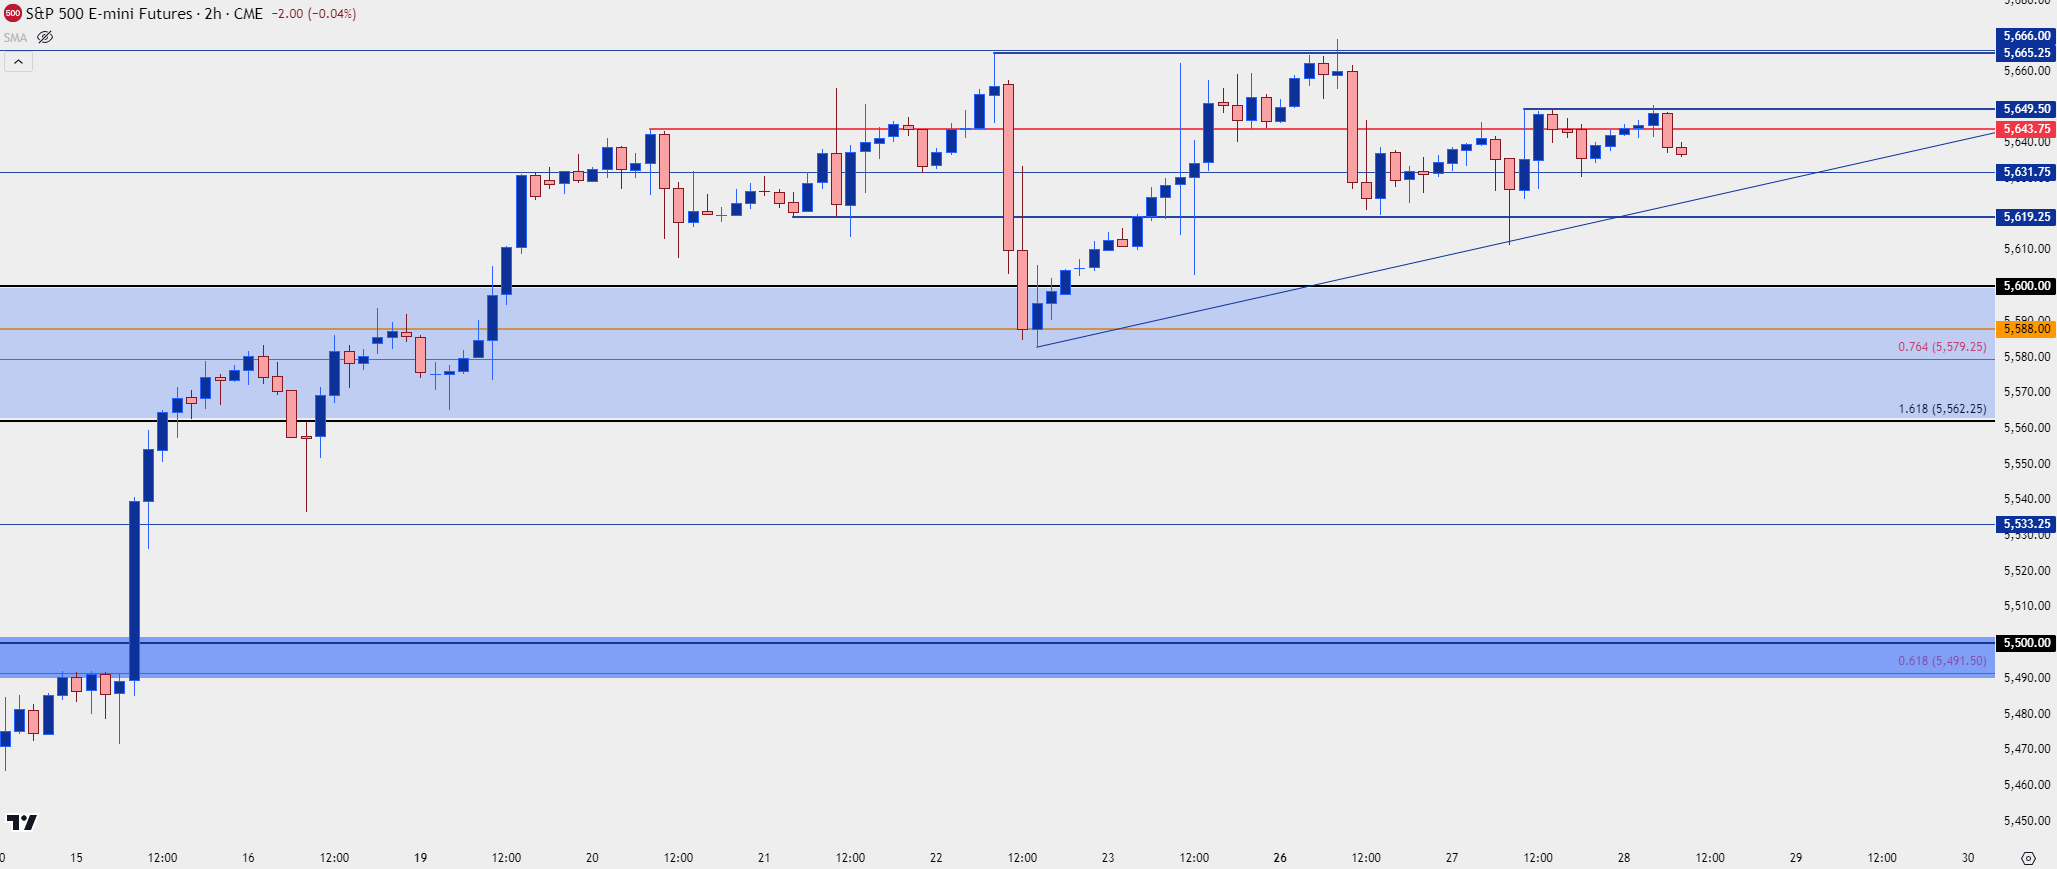
On a shorter-term basis the S&P 500 has been quite choppy, as can be seen from the two-hour chart below.
With NVDA earnings later tonight, it would seem an opportunity for a directional move to show, one way or the other. If NVDA disappoints then this range could end up serving as a lower-high inside of the 5700 zone that held the highs in July. If they don’t and if NVDA pushes-higher, challenging its own ATH, then the 5700 re-test would seem a likely scenario for the S&P 500 and at that point, the big question is bullish continuation given the proximity of rate cuts in the US.
With rate cuts appearing to be on the way, there could be an attractive opportunity cost for capital in US Treasuries and this is why rate cutting regimes aren’t always the major bullish driver of stock prices that many expect.
For bearish scenarios in the S&P 500, it’s the 5562-5600 zone that still looms large, perhaps even more so after last week’s support inflection there. Below that, another major test arrives around 5500, spanned down to the Fibonacci level at 5491.50. If sellers can take that out, as they did in early-August, the door would be open for sellers to take a larger swing at the bigger-picture move.
For levels, I’m looking at a similar picture as yesterday with only slight adjustments.
Support:
S1: 5619.25
S2: 5600
S3: 5579.25
S4: 5562.26
Resistance:
R1: 5649.50
R2: 5666
R3: 5700
R4: 5721.25
S&P 500 Two-Hour Price Chart
 Chart prepared by James Stanley; data derived from Tradingview
--- written by James Stanley, Senior Strategist


