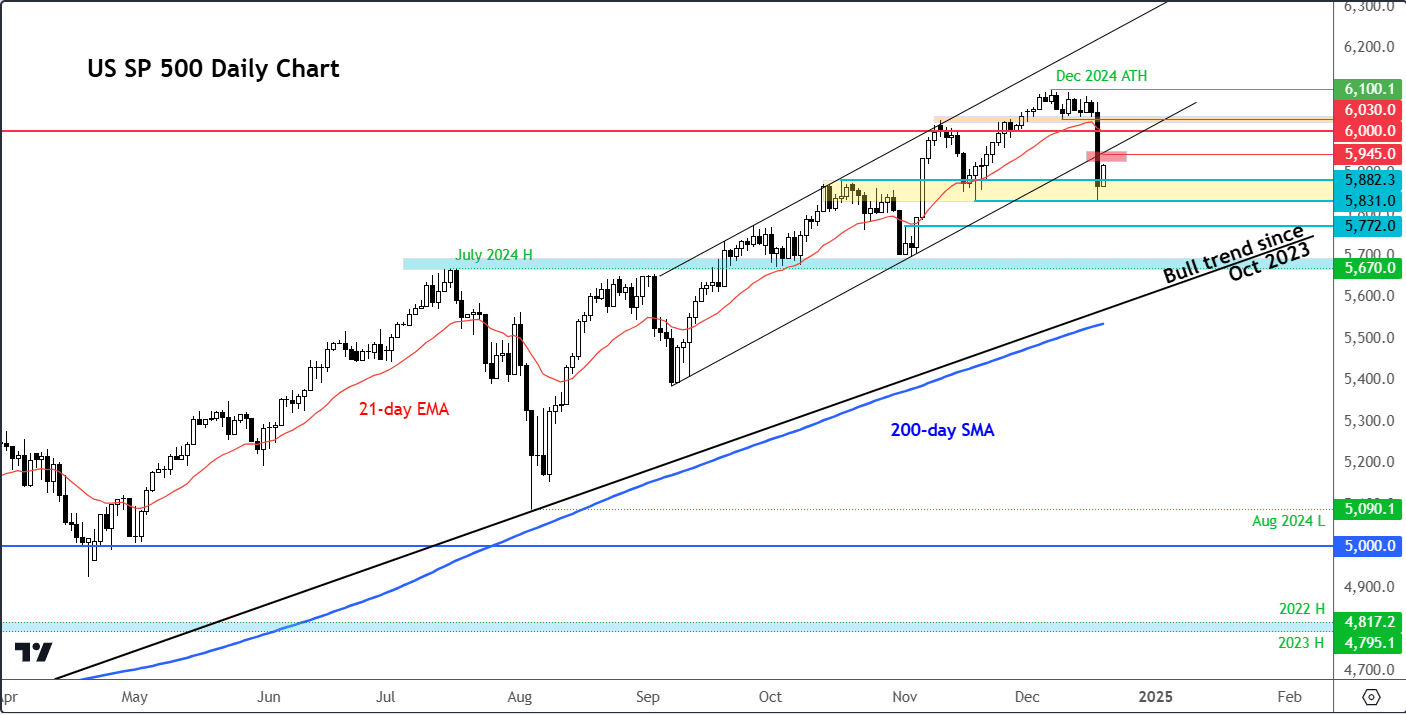
S&P 500 forecast: US stocks saw a sharp drop on Wednesday after the Fed pivoted to a more hawkish 2025 outlook, signalling only two rate cuts worth 50 basis points for the year. This abrupt shift renewed fears of stagflation heading into the new year. While the bulls hope AI enthusiasm will counterbalance these risks, the current rally in risk appetite may now face some headwinds. That said, in the aftermath of the FOMC’s announcement, S&P 500 futures rebounded overnight, and so the cash markets look poised for a firmer open. The Asia-Pacific markets rallied overnight, led by Japan’s Nikkei after the Bank of Japan refrained from raising rates, causing a sharp depreciation in the yen. Bitcoin briefly dipped below $100K but bounced back along with other risk assets, maintaining this critical psychological threshold for now.
Dow's streak raises concerns for broader markets
The recent bearish trend isn’t confined to the S&P 500. The Dow Jones Industrial Average has experienced its first 10-day losing streak since 1974, shedding nearly 2,900 points over two weeks from its highest to its lowest points. This erosion of value stock momentum contrasts starkly with the tech-driven resilience of the S&P 500 and Nasdaq 100.
Adding to concerns, fewer than 39% of S&P 500 stocks are trading above their 50-day moving averages despite the index hovering near record highs until Wednesday’s decline. Only about 30% of S&P 500 stocks have outperformed the index year-to-date, repeating a worrying pattern last seen during the Dot-com bubble. This concentration of market gains in a handful of tech stocks leaves the broader market vulnerable should the tech rally falter.
Technical S&P 500 forecast: Key Levels to Watch
The S&P 500 has bounced back from the post-FOMC lows but remain at critical technical levels. The 5831-5882 zone, a previous resistance area in October, has now turned into a key support. The mid-November test of this area held, and it has done so again for now. As long as this zone holds, a deeper correction might be averted.
However, if the index breaks decisively below this range, it could trigger a drop toward 5772 initially, with the July high at 5670 acting as subsequent support. A breach below these levels could expose the long-term bullish trendline and the 200-day moving average near 5540.
For the bears, the key area to defend is the 6,000-6030 resistance zone. This was a pivotal area before the post-FOMC selloff and now represents a critical barrier. A failure to reclaim this zone would embolden sellers, potentially leading to renewed downside pressure. Ahead of this, the backside of the broken trend support of the bullish channel that had been in place since September, comes in at 5945. This level may be an additional resistance to watch today.

Source: TradingView.com
Santa rally or seasonal setback?
With the major risk events of the week behind us, the question remains: will the traditional Santa rally take hold, or will 2024 mark a departure from the norm? The fading bullish momentum on the S&P 500 chart and deteriorating market breadth suggest caution, but let’s see if the market, despite all the doom and gloom, managed to once again find a bottom and provide a bullish signal. For now, caution is warranted in light of this week’s price action and Fed’s hawkish message.
-- Written by Fawad Razaqzada, Market Analyst
Follow Fawad on Twitter @Trader_F_R


