Oil Price Outlook
The price of oil slips to a fresh weekly low ($68.27) despite a larger-than-expected decline in US crude inventories, and a move below 30 in the Relative Strength Index (RSI) is likely to be accompanied by lower oil prices like the price action from March.
Oil price forecast: crude susceptible to oversold RSI
The price of oil continues to pare the advance from the yearly low ($64.36) after filling the price gap triggered by Organization of the Petroleum Exporting Countries (OPEC), and the RSI may show the bearish momentum gathering pace as it approaches oversold territory.

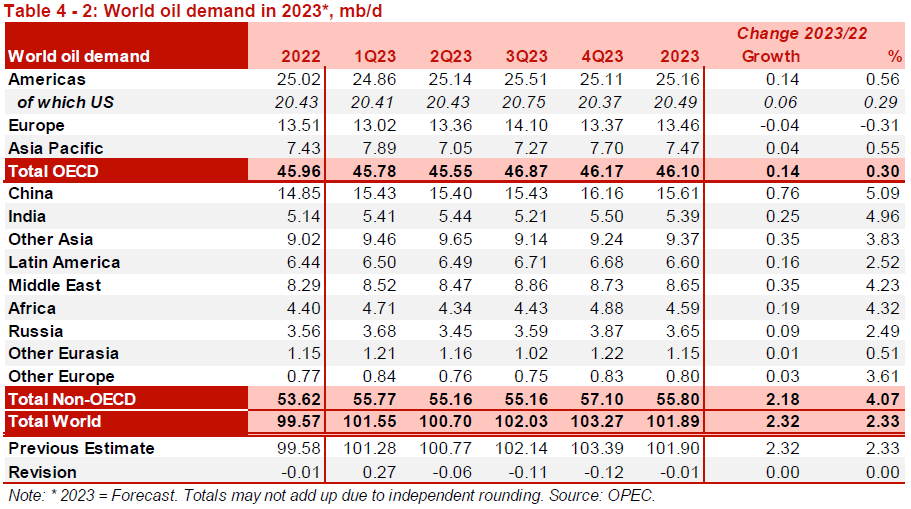
At the same time, it seems as though developments coming out of the US will do little to curb the decline in the price of oil as it shows a limited reaction to the 1.28M contraction in crude inventories, and it remains to be seen if OPEC and its allies will implement more voluntary production cuts as the most recent Monthly Oil Market Report (MOMR) states that the ‘2023 global economic growth forecast remains unchanged at 2.6%.’

Source: OPEC
The April MOMR goes onto say that the ‘forecast for 2023 world oil demand growth remains at 2.3 mb/d, also broadly unchanged from last month’s assessment,’ but the price of oil may continue to face headwinds ahead of the next Joint Ministerial Monitoring Committee (JMMC) meeting on June 4 as the ongoing contraction in US inventories fails to curb the weakness in crude prices.
With that said, the price of oil may continue to give back the advance from the yearly low ($64.36) as it extends the series of lower highs and lows from the start of the week, and a move below 30 in the Relative Strength Index (RSI) is likely to be accompanied by lower oil prices like the price action from March.
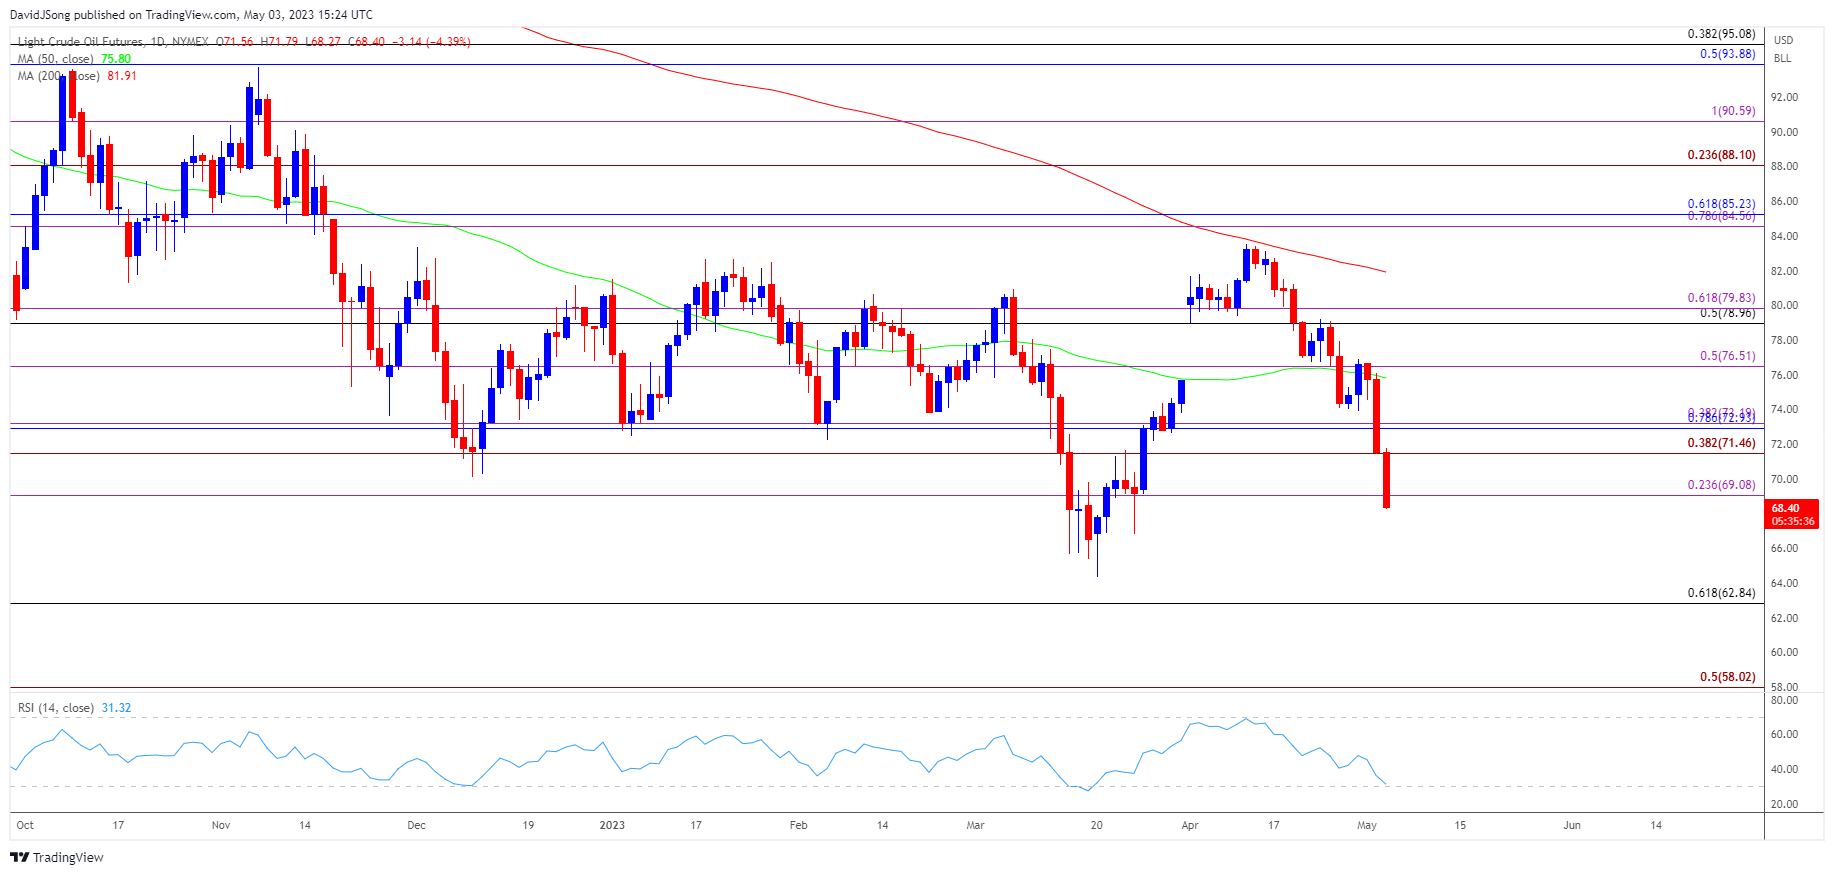
Oil Price Chart – WTI Daily

Chart Prepared by David Song, Strategist; Oil Price on TradingView
- The price of oil reversed course following the failed attempts to clear the 200-Day SMA ($81.91), with crude trading back below the 50-Day SMA ($75.81) as it extends the series of lower highs and lows from the start of the week.
- A close below $69.10 (23.6% Fibonacci extension) may push the price of oil towards the yearly low ($64.36), with a move below 30 in the Relative Strength Index (RSI) likely to be accompanied by lower oil prices like the price action from March.
- Failure to defend the yearly low ($64.36) opens up the $62.80 (61.8% Fibonacci retracement) region, with the next area of interest coming in around the December 2021 low ($62.43).
- Need a move above $71.50 (38.2% Fibonacci extension) to negate the bearish price action in crude, with the next area of interest coming in around $72.90 (78.6% Fibonacci retracement) to $73.20 (38.2% Fibonacci extension).
Additional Resources:
EUR/USD forecast: monthly low in place ahead of Fed and ECB?
USD/JPY rate outlook vulnerable to dovish Fed rate hike
--- Written by David Song, Strategist


