Despite the BOJ’s best efforts to contain inflation, prices are indeed rising.
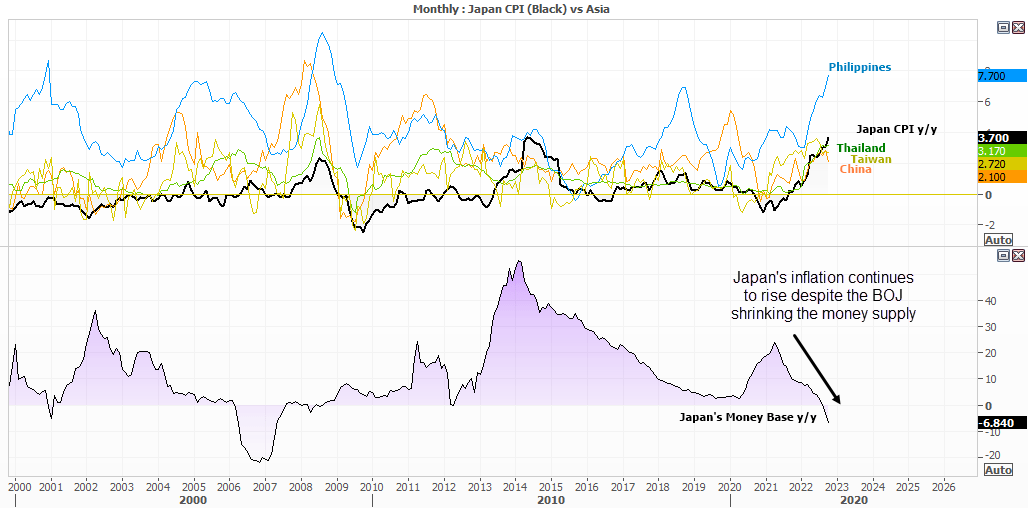
- Nationwide inflation rose to its highest levels since 1984 at 3.7% y/y and core inflation is also at 3.6%.
- If food and energy are excluded, CPI is now 1.4% y/y – which is its highest since 1998 we exclude the pre-emptive buying ahead of 2015’s tax hikes.
- Services PPI is down to 9.1% but historically high after peaking at 10.2% last month

Japan's inflation is nearly twice the BOJ's target
At 3.7%, nationwide CPI is nearly twice their 2% target. The BOJ were relatively late to the ‘2% inflation’ bandwagon by introducing their 2% target in January 2013. Of the 118 months since it was introduced, only 16.1% (19) of them have been above 2%. There was a 12-month period from April 2014, and more recently inflation has been above 2% since April this year and still rising.
It’s also interesting to note that rising prices Japan have been delayed, compared with Western countries and Asian trading partners. And this is despite the money base falling -6.5% y/y, which is its fastest pace since 2007.
Will the BOJ ever hike interest rates?
Never say never, but they still appear to be in no rush. With that said, the recent Summary of opinions highlighted that ‘some’ members expressed concern about elongating ultra-dovish policies, and risks to inflation.
So far, the BOJ have maintained their yield curve control target (YCC) at the expense of a weaker yen to help boost exports and growth, whilst keeping interest rates at -0.1%. But if prices continue to rise there is surely a case to be made for interest rates to be zero, or even above. Yet time and time again the BOJ have poured cold water on the conventional method, and veer towards the unconventional. So be prepared for the BOJ to remain in negative interest rates longer than investors can remain solvent betting against them.
USD/JPY daily chart:

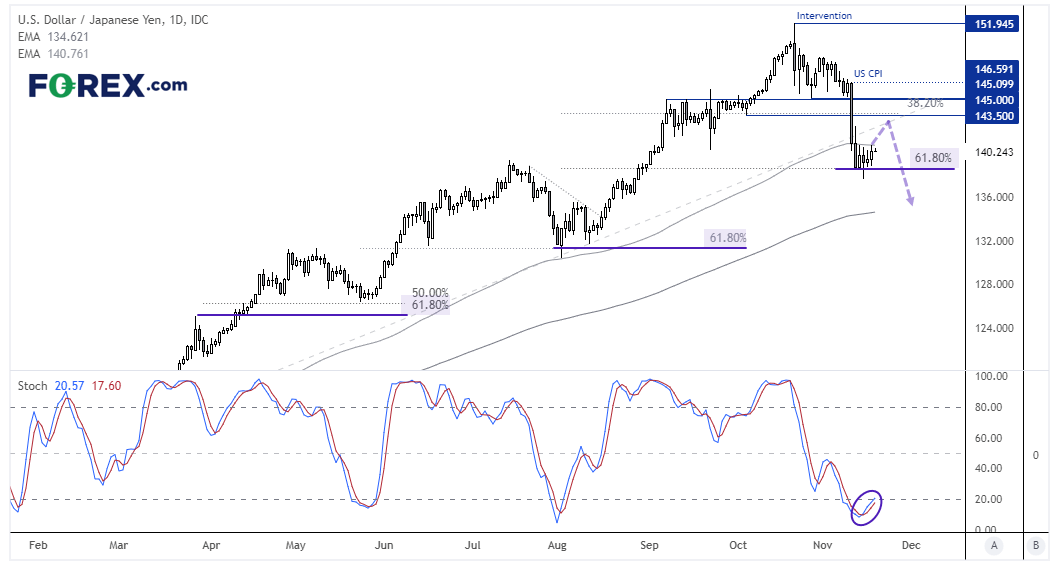
Hopes of a Fed pivot, stemming from soft US inflation data, has been the main driver of USD/JPY over the past week. This saw the pair break trend support and briefly trade blow 137. The 61.8% Fibonacci level has provided support, like it has previously during this trend and it’s also worth noting the stochastic oscillator has generated a buy signal in the overbought zone. Furthermore, looking across USD pairs suggests the dollar could be due a retracement higher.
USD/JPY 4-hour chart:

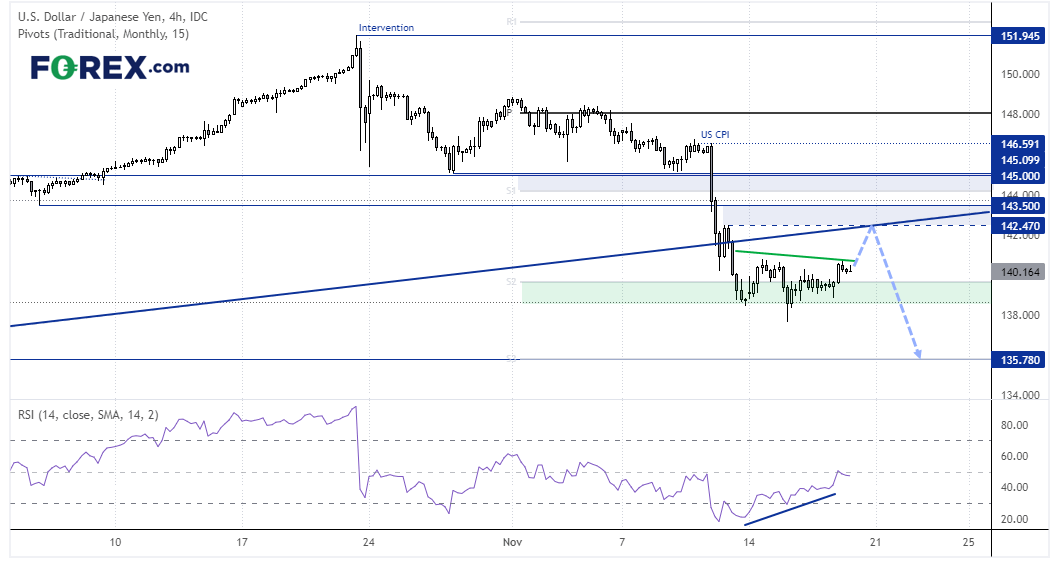
The 4-hour chart shows a bullish divergence formed on the RSI (14), and prices are trying to break above trend resistance. Price action appears to be corrective, but the lower spike and upturn in momentum suggests the market may try to break higher towards the broken trendline. If that occurs, we’d look for evidence of a swing high and seek short positions. Alternatively, a break beneath 138.80 assumes bearish continuation.
How to trade with FOREX.com
Follow these easy steps to start trading with FOREX.com today:
- Open a Forex.com account, or log in if you’re already a customer.
- Search for the pair you want to trade in our award-winning platform.
- Choose your position and size, and your stop and limit levels.
- Place the trade.


