Japanese Yen Technical Forecast: USD/JPY Weekly Trade Levels
- Japanese Yen breaks out of multi-month consolidation / yearly opening-range
- USD/JPY rally approaching major resistance hurdles ahead of FOMC, BoJ
- Resistance 140.33/72, 142.50 (key), 147.69- support 137.60s, 136.49/80, 132.46
The Japanese Yen is poised to mark a second weekly gain against the US Dollar with USD/JPY off by more than 1.5% from the yearly high. While a breakout of the yearly opening-range keeps the broader focus weighted to the topside, the advance is now approaching key technical hurdles into uptrend resistance with the FOMC and BoJ interest rate decisions on tap- risk for some price inflection in the weeks ahead. These are the updated targets and invalidation levels that matter on the USD/JPY weekly technical chart.
Review my latest Weekly Strategy Webinar for an in-depth breakdown of this Yen setup and more. Join live on Monday’s at 8:30am EST.
Japanese Yen Price Chart – USD/JPY Weekly

Chart Prepared by Michael Boutros, Sr. Technical Strategist; USD/JPY on TradingView
Technical Outlook: In last month’s Japanese Yen technical forecast we noted that, “USD/JPY is trading just below resistance near the 2023 range highs with price continuing to contract within the confines of a massive multi-month consolidation pattern. From a trading standpoint, the trade remains constructive while above yearly open with a breach / close above the December trendline needed to fuel a larger breakout in USD/JPY.” A breakout the following week fueled a rally of more than 5.5% off the May low with the advance exhausting just ahead of uptrend resistance into the close of the month.
The June opening-range is now set just below resistance at the 100% extension / yearly high-close at 140.33/72 with a more significant zone just higher at the 61.8% retracement of the 2022 decline at 142.50- look for a larger reaction there IF reached. Ultimately a pivot above the upslope is needed to mark resumption towards the 2022 high-week close at 147.69.
Initial weekly support now rests with the November slope (red – former resistance) near ~137.60 backed by the February high-close / 52-week moving average at 136.49/80- losses should be limited to this threshold IF price is heading higher on this stretch. Broader bullish invalidation now raised to the 61.8% Fibonacci retracement of the yearly range at 132.46.
Bottom line: A breakout of the yearly opening-range in USD/JPY is now testing the first major resistance hurdle. From a trading standpoint, losses should be limited to 136.49 IF price is heading higher on this stretch with a breach above 142.50 ultimately needed to mark resumption of the broader uptrend. I’ll publish an updated Japanese Yen short-term outlook once we get further clarity on the near-term USD/JPY technical trade levels.
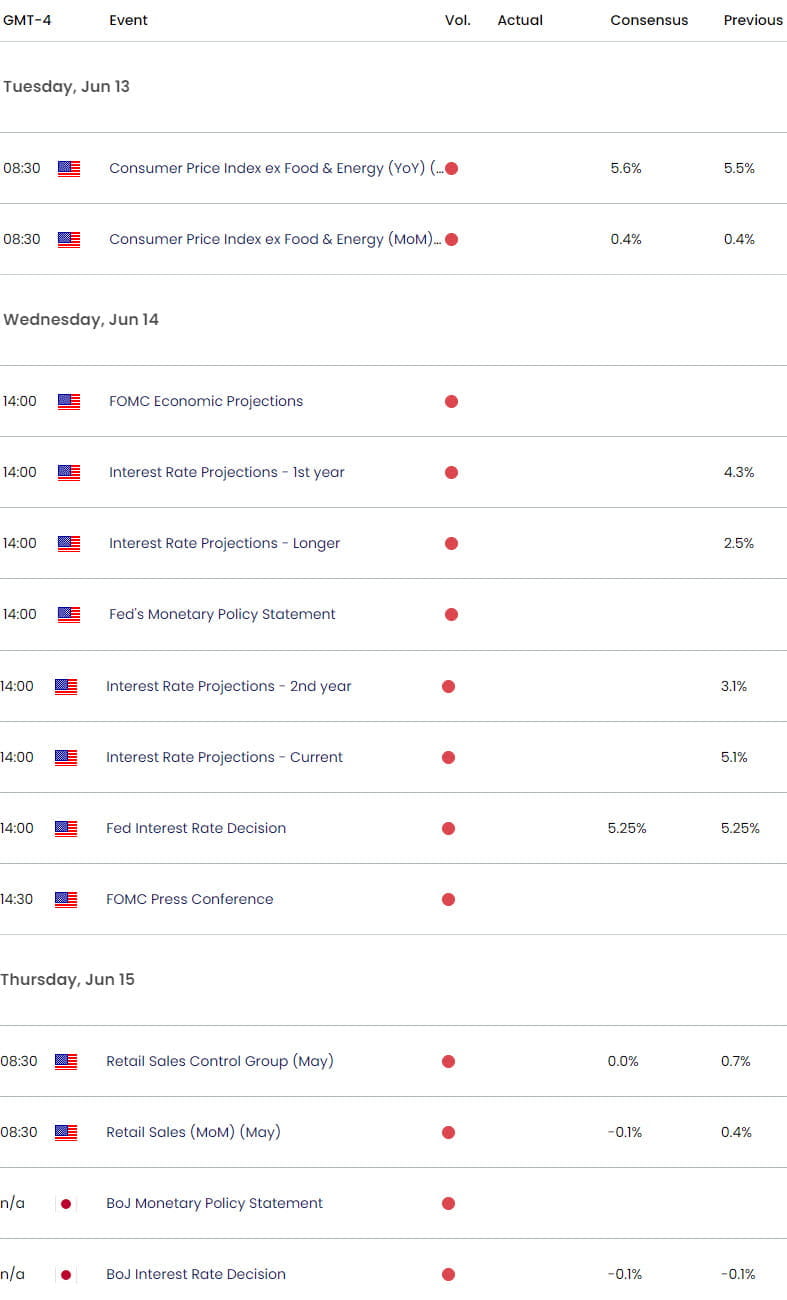
Key Economic Data Releases

Economic Calendar - latest economic developments and upcoming event risk.
Active Weekly Technical Charts
- Australian Dollar (AUD/USD)
- British Pound (GBP/USD)
- US Dollar (DXY)
- Gold (XAU/USD)
- Crude Oil (WTI)
- Canadian Dollar (USD/CAD)
- S&P 500, Nasdaq, Dow Jones
- Euro (EUR/USD)
--- Written by Michael Boutros, Sr Technical Strategist with FOREX.com
Follow Michael on Twitter @MBForex


