- Gold, silver acting as inflation hedges
- Dollar strength, rising yields fail to curb gains
- Rallies stall at known resistance levels
- Momentum signals favour bullish bias near-term
Summary
Gold and silver have increasingly behaved as inflation hedges over the past month, perhaps explaining why both are sitting at multi-week highs despite elevated US bond yields and continued US dollar strength. With the setups discussed earlier in the week having played out, this note provides fresh thinking about near-term directional risks.
Inflation hedge against tariff threat?
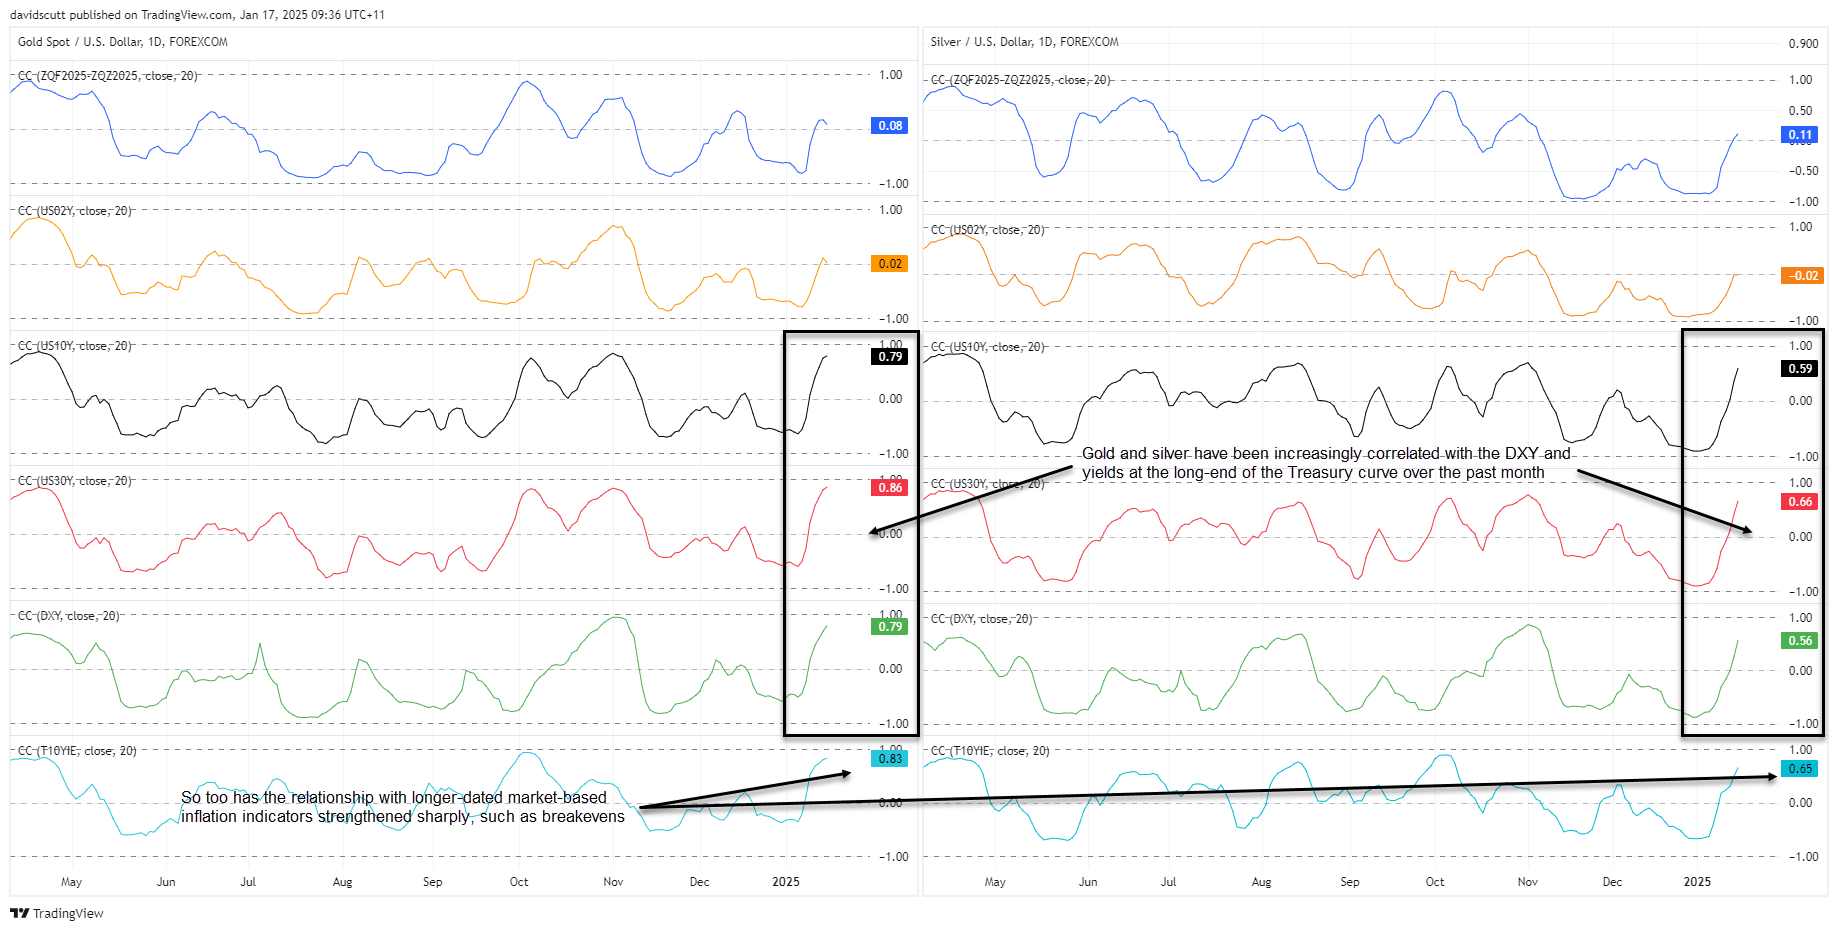
The correlation between gold and silver with longer-dated US Treasury yields and the US dollar index has strengthened sharply over the past month. This is an odd occurrence given higher interest rates and a firmer dollar typically create an environment in which non-yielding precious metals struggle. But not right now.
Clues as to what may be driving this resilient performance can be found in the bottom pane of the chart below, which looks at the rolling 20-day correlation coefficient score for gold and silver against US 10-year inflation breakevens. This market tracks implied average annual inflation rates over the next decade, based on yield spreads between Treasuries and inflation-protected securities with similar maturities.

Source: TradingView
At 0.83, the relationship with gold has been strong and continues to strengthen in early 2025, coinciding with the period leading up to Donald Trump’s Presidential inauguration next week. After much speculation, we’re about to receive clarity on tariff threats made during the campaign.
While not as strong as gold, the relationship between silver and inflation expectations is positive and strengthening. My sense is that just as tariff speculation is contributing to ongoing US dollar strength despite the recent decline in Treasury yields, it’s also boosting the appeal of precious metals.
It’s difficult to assess how much has already been priced in regarding flagged tariffs announced by Trump. The theory will be tested depending on what is enacted through the looming executive orders. Tariffs of 25% on Mexico and Canada imports, up to 60% on China, and 10% on everyone else are on the table. The timing – whether staggered or immediate – will have a significant bearing on the expected inflation outlook, influencing bond yields, the dollar, and likely gold and silver.
Gold bulls eye triangle break

Source: TradingView
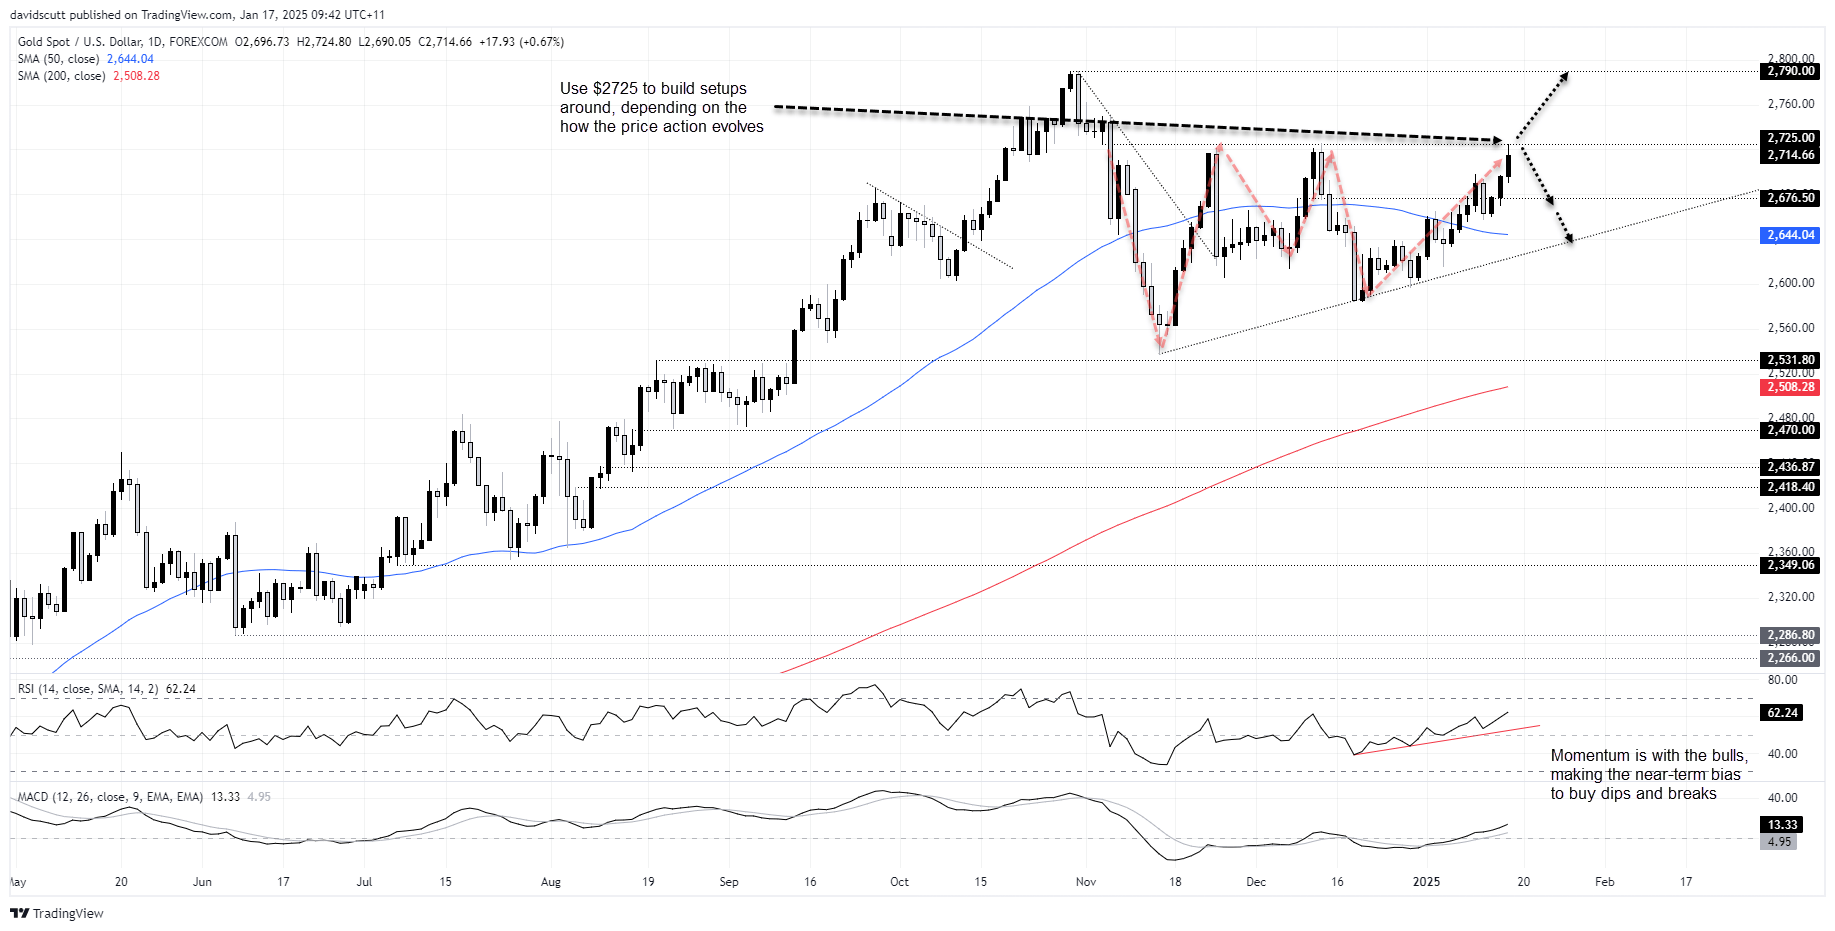
The bounce in gold anticipated earlier this week played out faster than expected, with bears balking ahead of the key 50-day moving average. The price subsequently pushed through minor resistance at $2676.50 before kissing $2725 on Thursday.
Gold appears to be sitting in an ascending triangle on the daily timeframe, stalling at this level previously while recording a string of higher lows since mid-November. With RSI (14) and MACD continuing to provide bullish signals, momentum is with the bulls, hinting at a potential retest of $2725 soon.
If the price were to break and hold above this level, one setup to consider would be buying with a tight stop beneath for protection. The obvious target would be the record high of $2790 set in late October.
However, if the price fails to break and hold $2725, the setup could flip, with shorts initiated beneath and a stop above, targeting $2676.50, the 50-day moving average, or even the November uptrend.
Given the price action and momentum signals, the bias remains to buy dips and breaks but let the price action dictate how to proceed.
Silver sits at interesting juncture

Source: TradingView
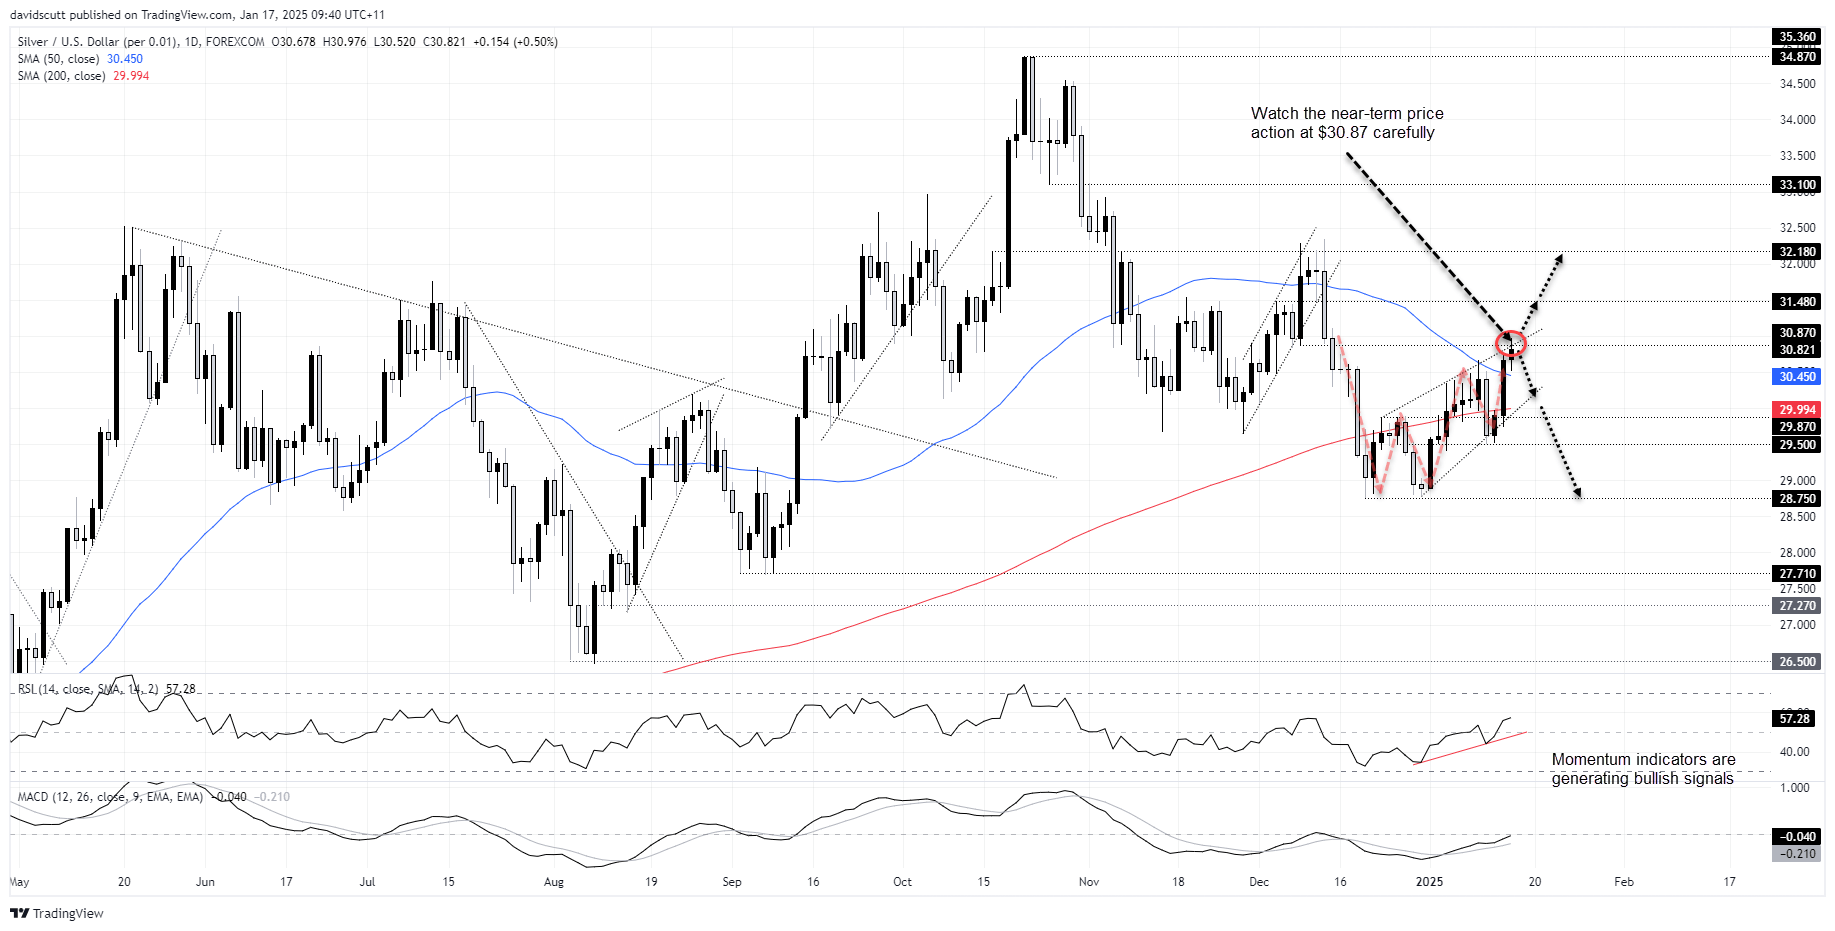
Silver had a nice bounce from support at $29.50 earlier this week, sparking a rally that saw the price take out the 50 and 200-day moving averages before stalling above minor resistance at $30.87.
Silver now sits at an interesting juncture on the charts, especially with momentum indicators such as RSI (14) and MACD generating bullish signals. Not only did the rally stall on Thursday at known resistance, but it also coincides with the top of the rising wedge it has been trading in since late 2024.
That makes the near-term price action important when it comes to longer-term directional risks.
Even though momentum is with the bulls, if the price can’t break cleanly above $30.87 it will open the door for shorts to be established looking for a reversal to wedge support. If such a move plays out, convention suggests it could lead to a deeper downside thrust towards $28.75.
But if the price can break and hold above $30.87, it may encourage bulls to join the move looking for a push towards $31.48 or $32.18.
-- Written by David Scutt
Follow David on Twitter @scutty


