Gold technical outlook: XAU/USD short-term trade levels
- Gold price March opening-range breakout stalls into uptrend resistance
- XAU/USD in consolidation just below - constructive while above 1912
- Resistance 1978, 2000, 2009 (key)– support ~1950s, 1933, 1912/18 (critical)
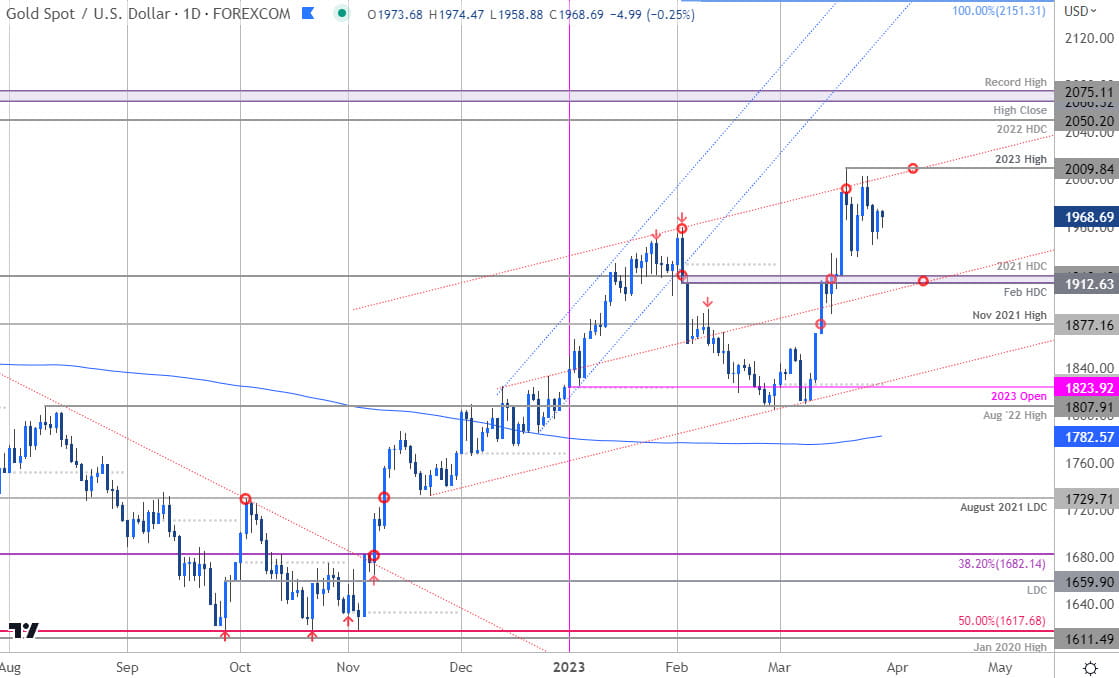
Gold prices have rallied a staggering 24% off the November 2022 lows with XAU/USD surging more than 10% this month alone. The rally stalled into uptrend resistance last week and the threat of a larger pullback within the confines of the broader uptrend remains. These are the updated targets and invalidation levels that matter on the XAU/USD short-term technical chart.
Discuss this gold setup and more in the Weekly Strategy Webinars on Monday’s at 8:30am EST.
Gold Price Chart – XAU/USD Daily

Chart Prepared by Michael Boutros, Sr. Technical Strategist; XAU/USD on TradingView
Technical Outlook: In last month’s Gold short-term price outlook we noted that a breakout of the March opening-range in XAU/USD was approaching initial resistance and that, “Ultimately a topside breach / close above the November 2021 highs at 1877 is needed to fuel the next leg higher in price.” Gold ripped through this threshold on March 13th with the rally extending more than 11% off them monthly lows. The advance faltered at uptrend resistance on building momentum divergence days later with price now holding within consolidation pattern just below- looking for the breakout to offer guidance here.
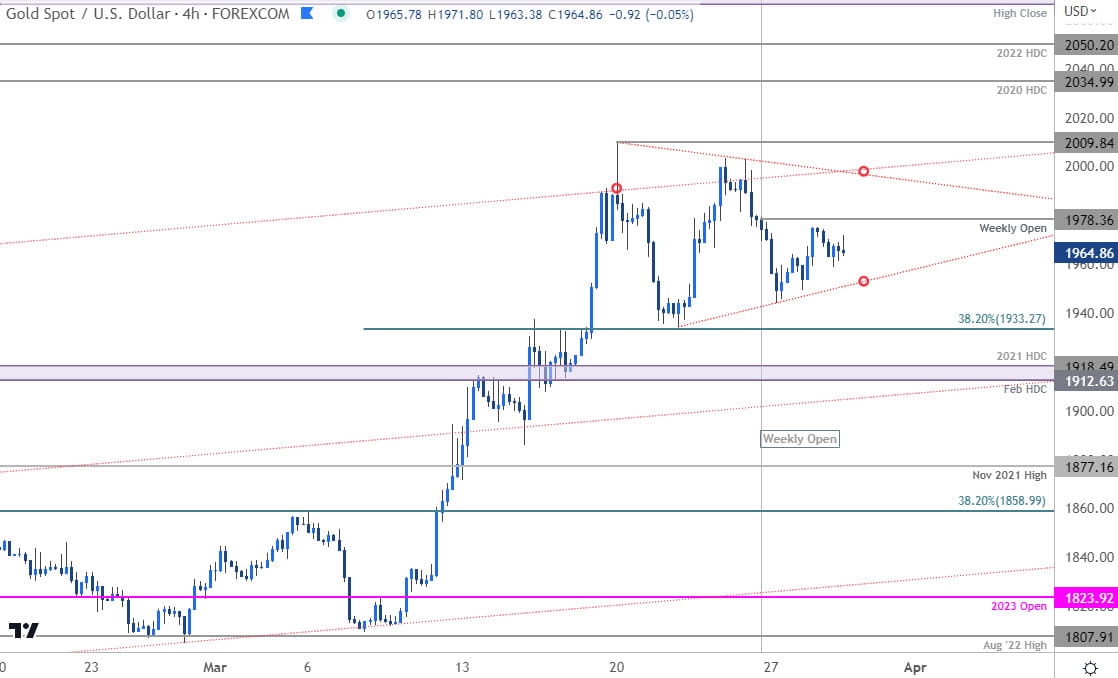
Gold Price Chart – XAU/USD 240min

Chart Prepared by Michael Boutros, Sr. Technical Strategist; XAU/USD on TradingView
Notes: A closer look at gold price action shows XAU/USD trading within the confines of a symmetrical triangle formation around the weekly open at 1978. Resistance stands at the highlighted slope confluence (near ~2000) with a breach / close above the yearly high at 2009 needed to mark resumption of the broader uptrend towards the 2020 high-day close at 2034, the 2022 high-day close at 2050 and the record high-close / high at 2066/75.
Initial support rests along the consolidation slope (currently ~1950s) backed by the 38.2% Fibonacci retracement the monthly range a 1933 and the February / 2021 high-day closes at 1912/18- both zones of interest for possible downside exhaustion / price inflection IF reached.
Bottom line: Gold is in consolidation just below uptrend resistance – breakout pending. From at trading standpoint, the threat for a pullback into uptrend support remains while within this formation- rallies should be capped by the weekly open at 1978 IF price is heading lower – ultimately, we’re looking for evidence of an exhaustion low in the days ahead with a close above the highs needed to mark resumption. As always, tread lightly here and stay nimble into the close of the month / quarter. Review my latest Gold weekly technical forecast for a longer-term look at the XAU/USD trade levels.
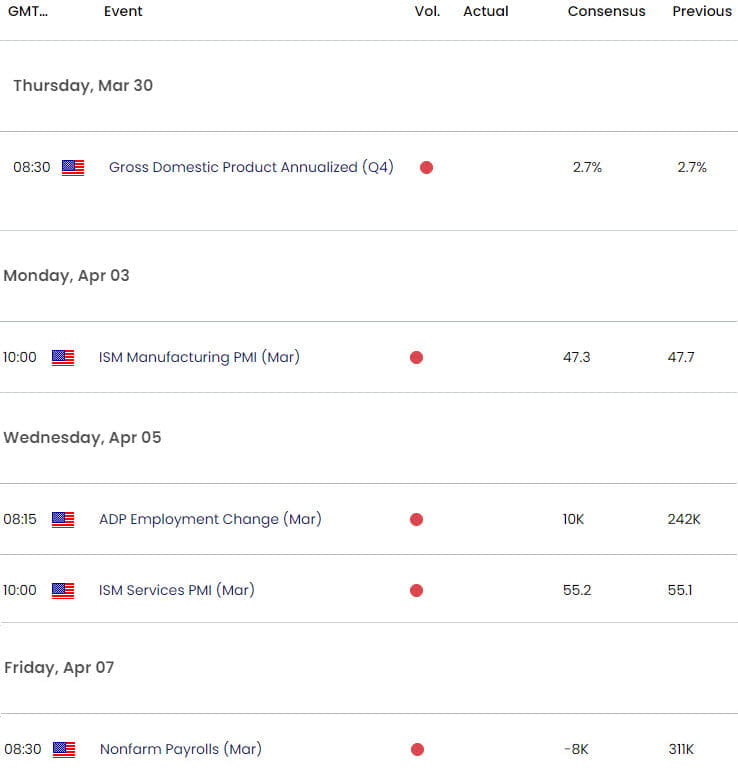
Key Economic Data Releases

Economic Calendar - latest economic developments and upcoming event risk.
Active Short-term Technical Charts
- Canadian Dollar short-term outlook: USD/CAD teases the break
- Euro short-term outlook: EUR/USD support test at prior resistance
- US Dollar short-term price outlook: six-days down into support
- Japanese Yen short-term price outlook: USD/JPY bears look to reassert
- Equities short-term outlook: S&P 500, Nasdaq, Dow breakdown levels
--- Written by Michael Boutros, Sr Technical Strategist with FOREX.com
Follow Michael on Twitter @MBForex


