Gold Price Outlook
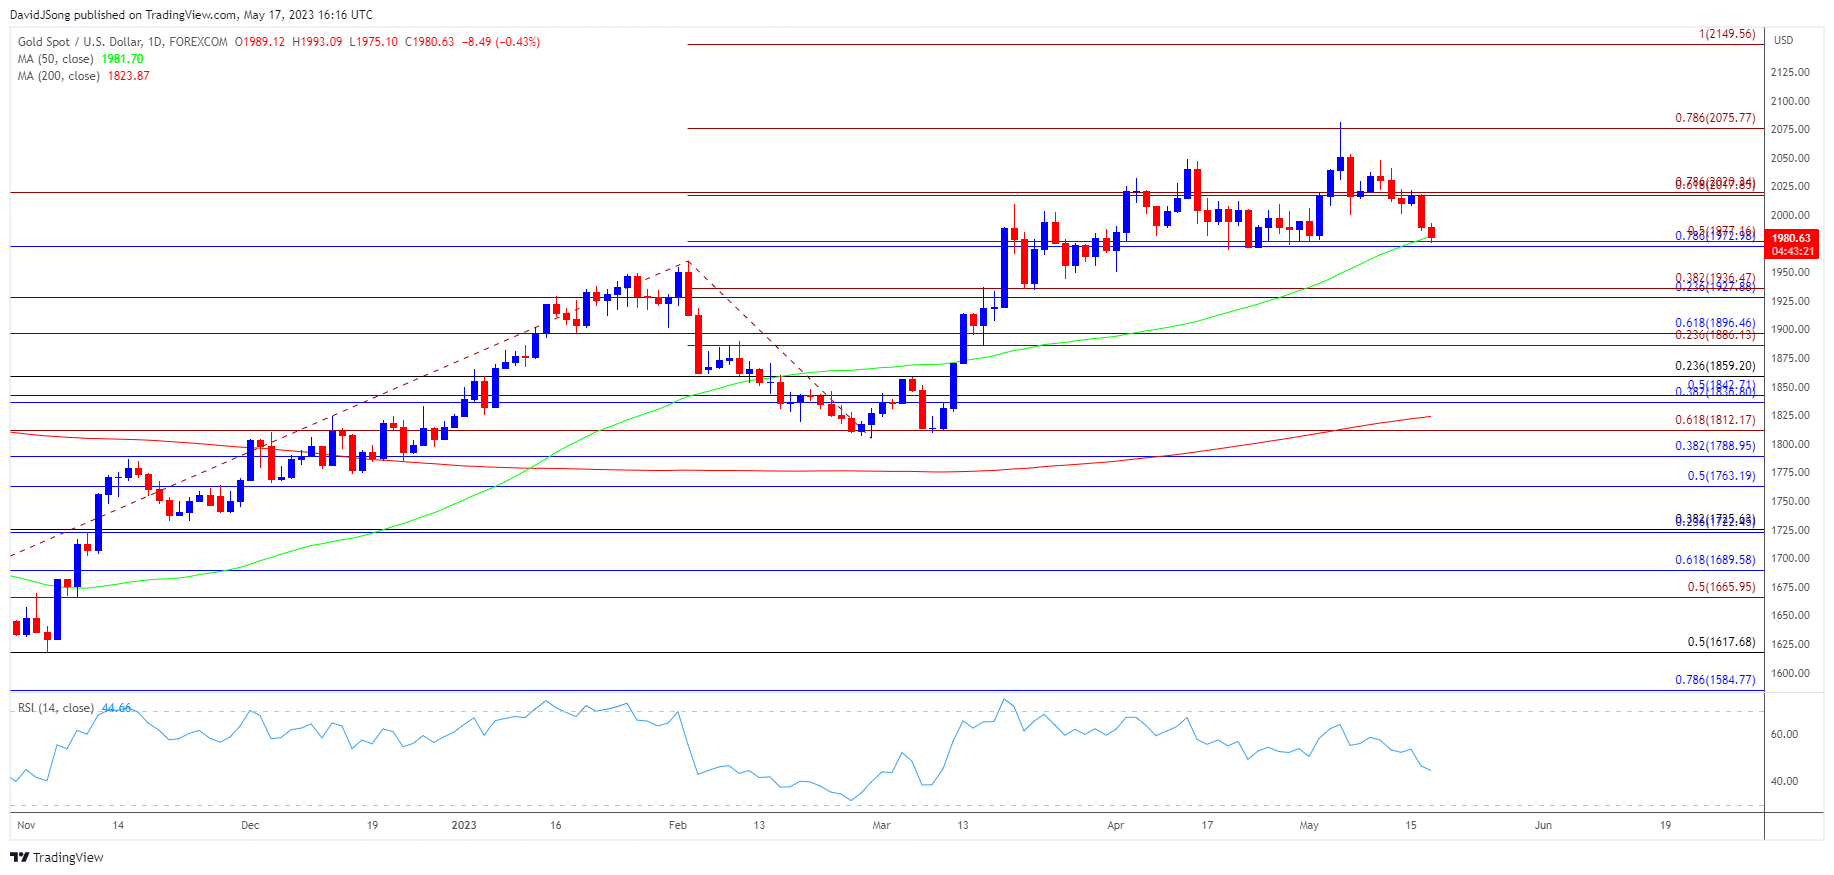
The price of gold registers a fresh monthly low ($1975) as it carves a series of lower highs and lows, and the limited reaction to the 50-Day SMA ($1982) may lead to a further decline in the precious metal as it fails to respond to the positive slope in the moving average.
Gold Price Vulnerable After Failing to Defend Monthly Opening Range
The price of gold fails to defend the opening range for May as it gives back the bullish reaction to the smaller-than-expected rise in US Retail Sales, and headlines coming out of the Federal Reserve may sway the near-term outlook for bullion as Chairman Jerome Powell is scheduled to speak later this week.
Join David Song for the Weekly Fundamental Market Outlook webinar. Register Here

It remains to be seen if Fed Chairman Powell will reveal anything new while speaking at the Thomas Laubach Research Conference as the current head of the central bank takes the stage with former-Chairman Ben Bernanke, and more of the same from Chairman Powell may generate a limited reaction as the Federal Open Market Committee (FOMC) plans to ‘take a data-dependent approach in determining the extent to which additional policy firming may be appropriate.’

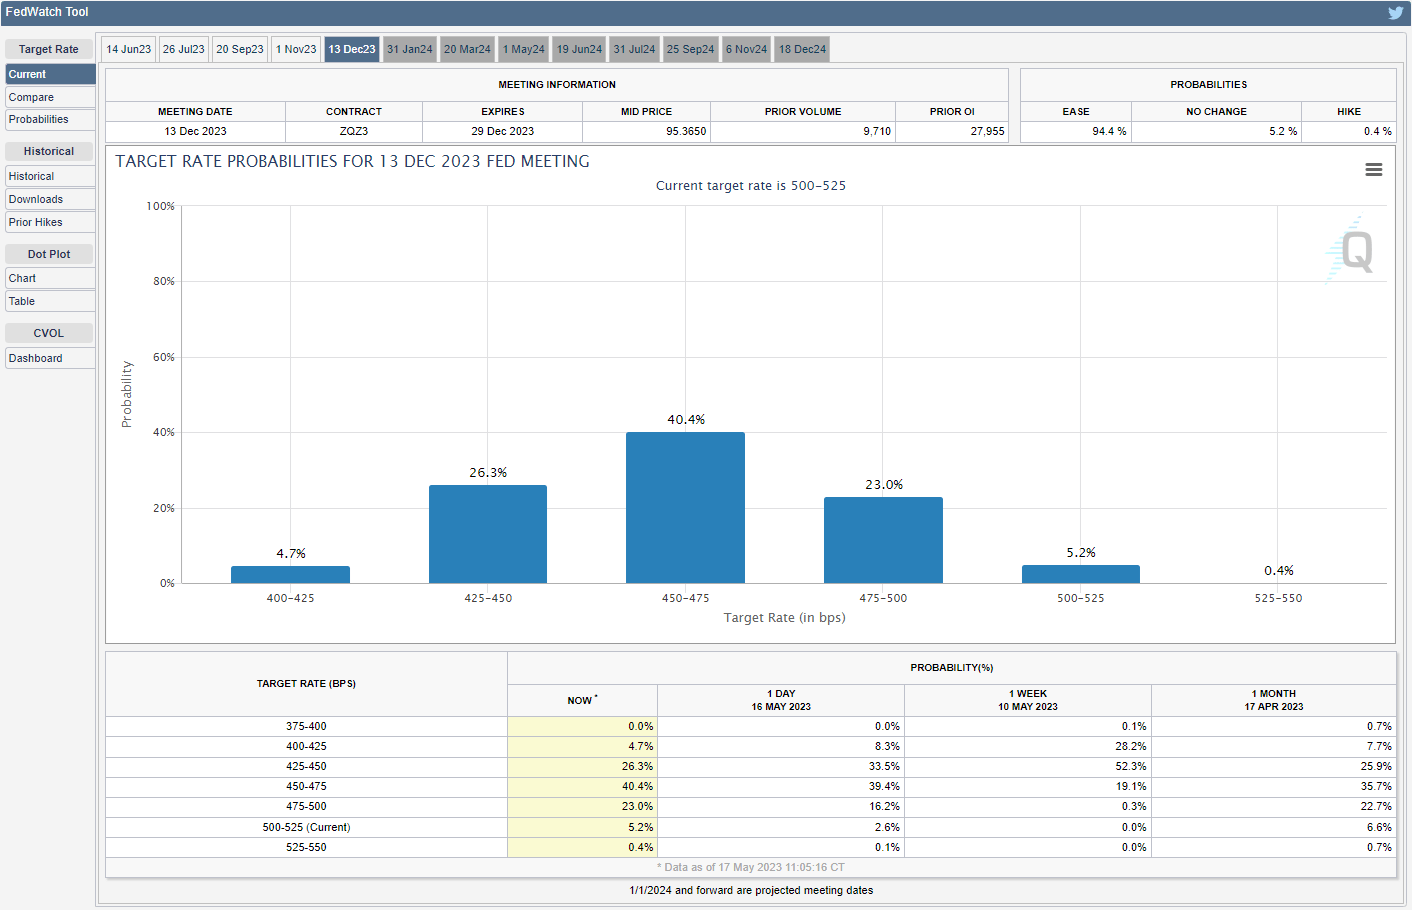
Source: CME
In turn, speculation for a looming change in regime may heighten the appeal of gold as the CME FedWatch Tool reflects bets for lower US interest rates later this year, but hints of a more restrictive policy may drag on bullion as the FOMC is ‘prepared to do more if greater monetary policy restraint is warranted.’
With that said, headlines coming out of the Fed may keep the price of gold under pressure if Chairman Powell tames expectations for a rate cut in 2023, and bullion may attempt to test the April low ($1950) as it fails to defend the monthly opening range.
Gold Price Chart – XAU/USD Daily

Chart Prepared by David Song, Strategist; Gold Price on TradingView
- The price of gold struggles to hold above the 50-Day SMA ($1982) as it registers a fresh monthly low ($1975), and failure to respond to the positive slope in the moving average may lead to a further decline in the precious metal as it carves a series of lower highs and lows.
- Need a break/close below the $1973 (78.6% Fibonacci retracement) to $1977 (50% Fibonacci extension) region to bring the April low ($1950) on the radar, with the next area of interest coming in around $1928 (23.6% Fibonacci retracement) to $1937 (38.2% Fibonacci extension).
- However, the price of gold may bounce along the moving average if it fails to break/close below the $1973 (78.6% Fibonacci retracement) to $1977 (50% Fibonacci extension) region, with a move above the $2018 (61.8% Fibonacci extension) to $2020 (78.6% Fibonacci extension) area bringing $2075 (78.6% Fibonacci extension) back on the radar.
Additional Resources:
USD/JPY Reverses Ahead of Monthly Low to Eye 200-Day SMA
Oil price outlook mired by failure to test 50-Day SMA
--- Written by David Song, Strategist
Follow me on Twitter at @DavidJSong


