Gold Price Outlook
The price of gold may attempt to retrace the decline following the better-than-expected US Non-Farm Payrolls (NFP) report as it holds within Friday’s range, but the update to the US Consumer Price Index (CPI) may drag on the precious metal if the figures reveal persistent inflation.
Gold price rebounds ahead of monthly low with US CPI on tap
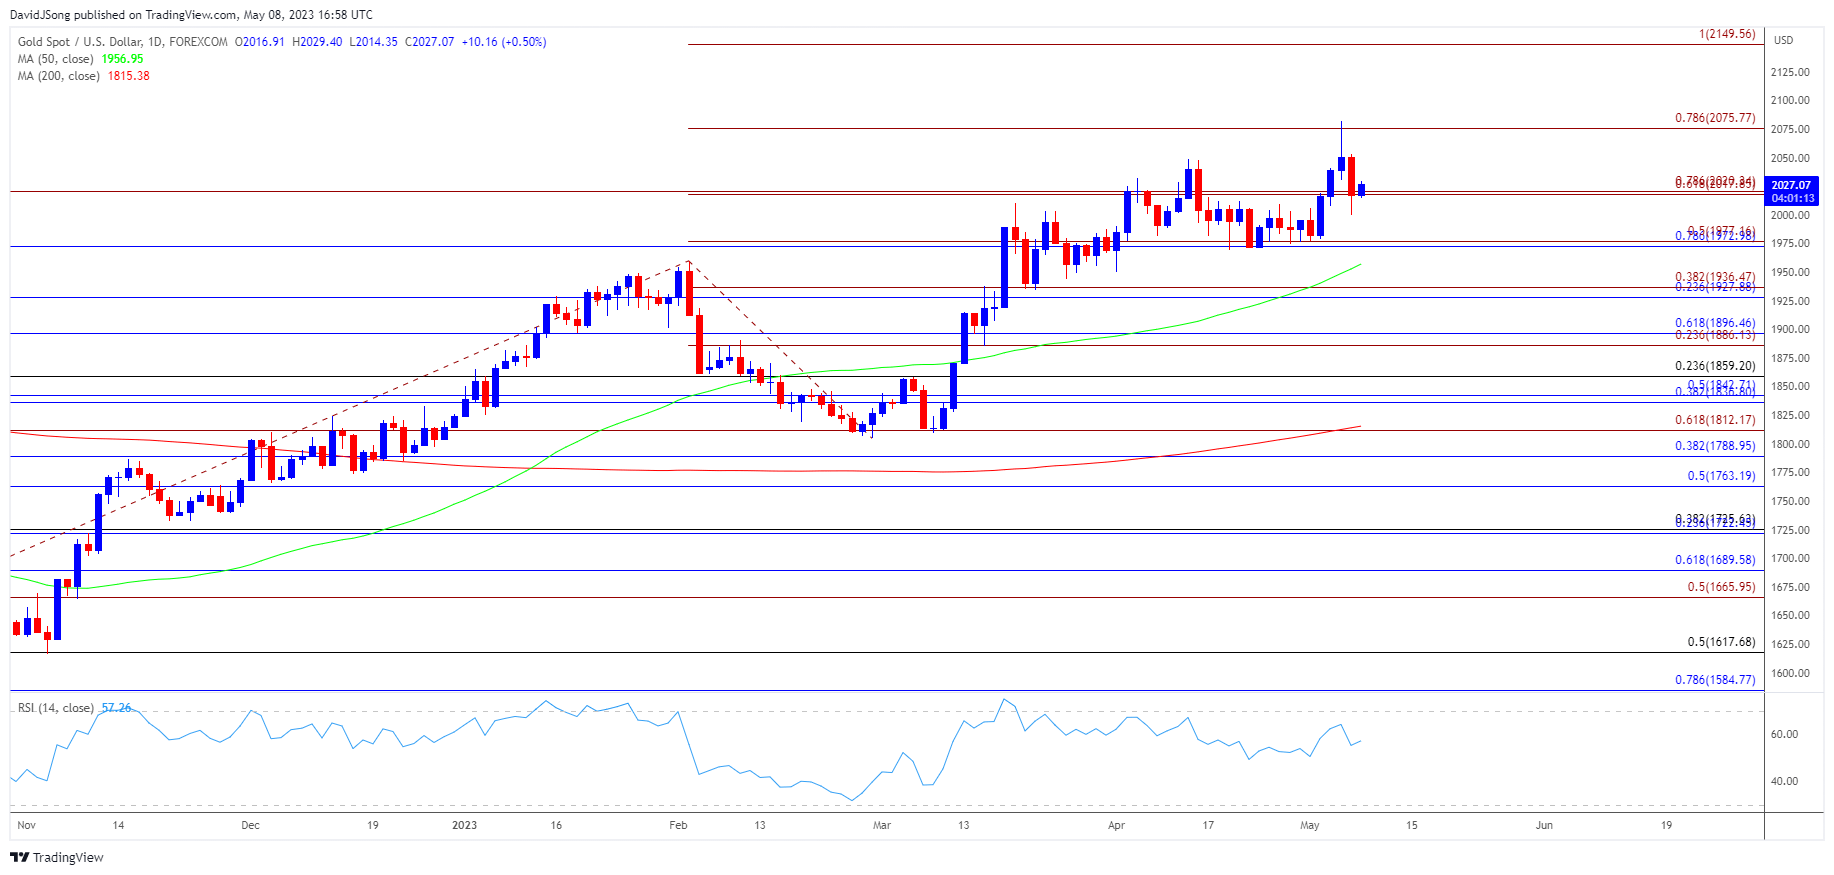
The price of gold consolidates after clearing the 2020 high ($2075) during the first full week of May, and bullion may retrace the decline from the yearly high ($2082) as it seems to be tracking the positive slope in the 50-Day SMA ($1957).
Join David Song for the Weekly Fundamental Market Outlook webinar. Register Here

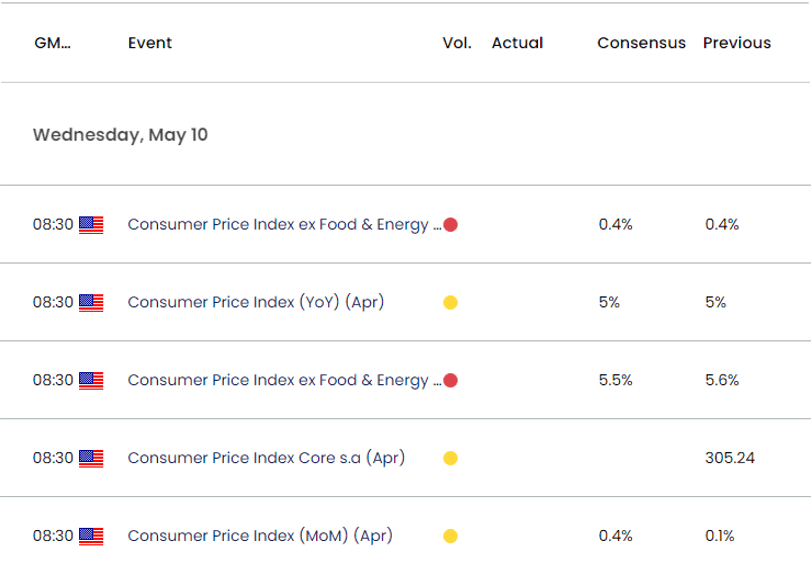
Looking ahead, the US CPI may influence the price of gold as the headline reading is expected to hold steady at 5.0% per annum in April, while the core rate of inflation is seen narrowing to 5.5% from 5.6% per annum during the same period.
Little signs of disinflation may curb the recent rebound in the price of gold as it raises the Federal Reserve’s scope to pursue a more restrictive policy, and it remains to be seen if the central bank will take further steps to combat inflation as Chairman Jerome Powell and Co. ‘are prepared to do more if greater monetary policy restraint is warranted.’

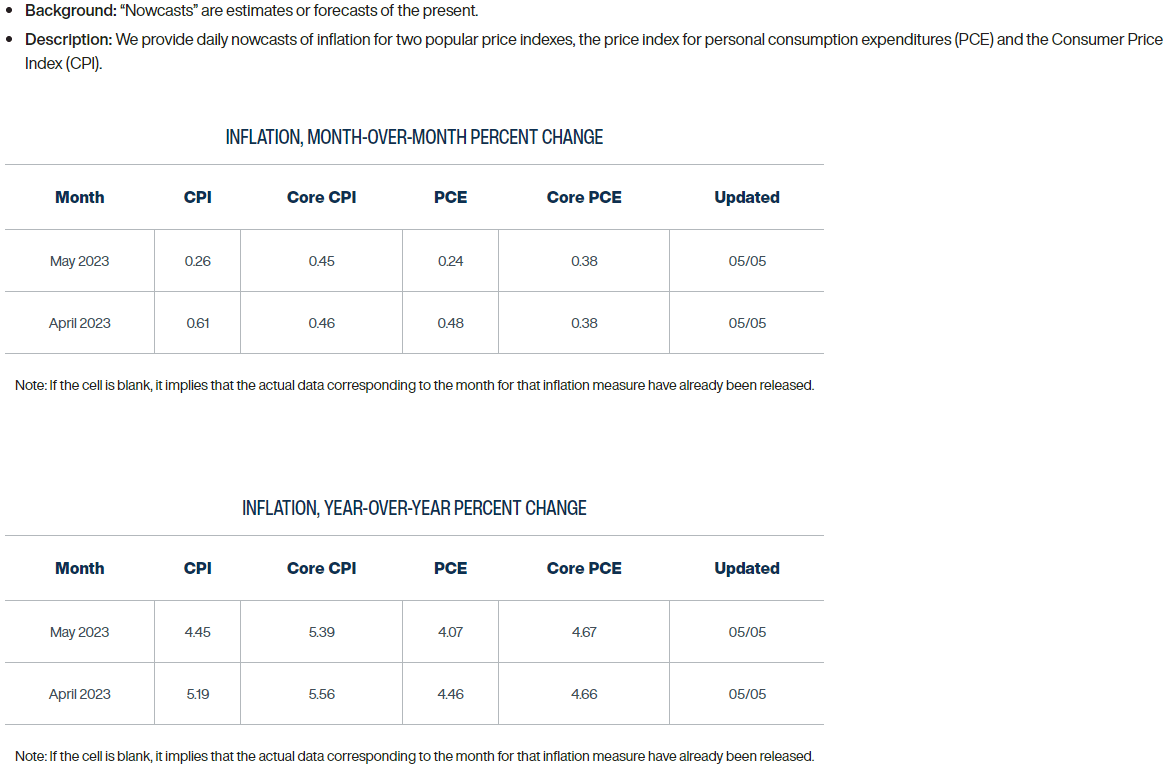
Source: Cleveland Fed
According to the Cleveland Fed’s Inflation Nowcasting model, the US CPI is projected to print at 5.2% while the core rate is expected to cross the wires at 5.6%, and a stronger-than-expected reading for consumer prices may generate a bearish reaction in gold as it undermines speculation for a looming change in regime.
With that said, the price of gold may face headwinds should the update to the CPI spark bets for higher US interest rates, but bullion may attempt to retrace the decline from the yearly high ($2082) as it seems to be tracking the positive slope in the 50-Day SMA ($1957).
Gold Price Chart – XAU/USD Daily

Chart Prepared by David Song, Strategist; Gold Price on TradingView
- The price of gold appears to be bouncing back ahead of the monthly low ($1977) as it curbs the recent series of lower highs and lows, and the exchange rate may track the positive slope in the 50-Day SMA ($1957) as it trades back above the $2018 (61.8% Fibonacci extension) to $2020 (78.6% Fibonacci extension) region.
- Failure to extends the recent series of lower highs and lows may push the price of gold back towards $2075 (78.6% Fibonacci extension), with a move above the monthly high ($2082) bringing the $2150 (100% Fibonacci extension) back on the radar.
- However, lack of momentum to hold above the $2018 (61.8% Fibonacci extension) to $2020 (78.6% Fibonacci extension) region may push the price of gold towards the monthly low ($1977), with a break/close below the $1973 (78.6% Fibonacci retracement) to $1977 (50% Fibonacci extension) area raising the scope for a test of the 50-Day SMA ($1957).
Additional Resources:
USD/CAD reverses ahead of April high with monthly open in focus
Oil price forecast: crude susceptible to oversold RSI
--- Written by David Song, Strategist


