Gold Price Outlook: XAU/USD
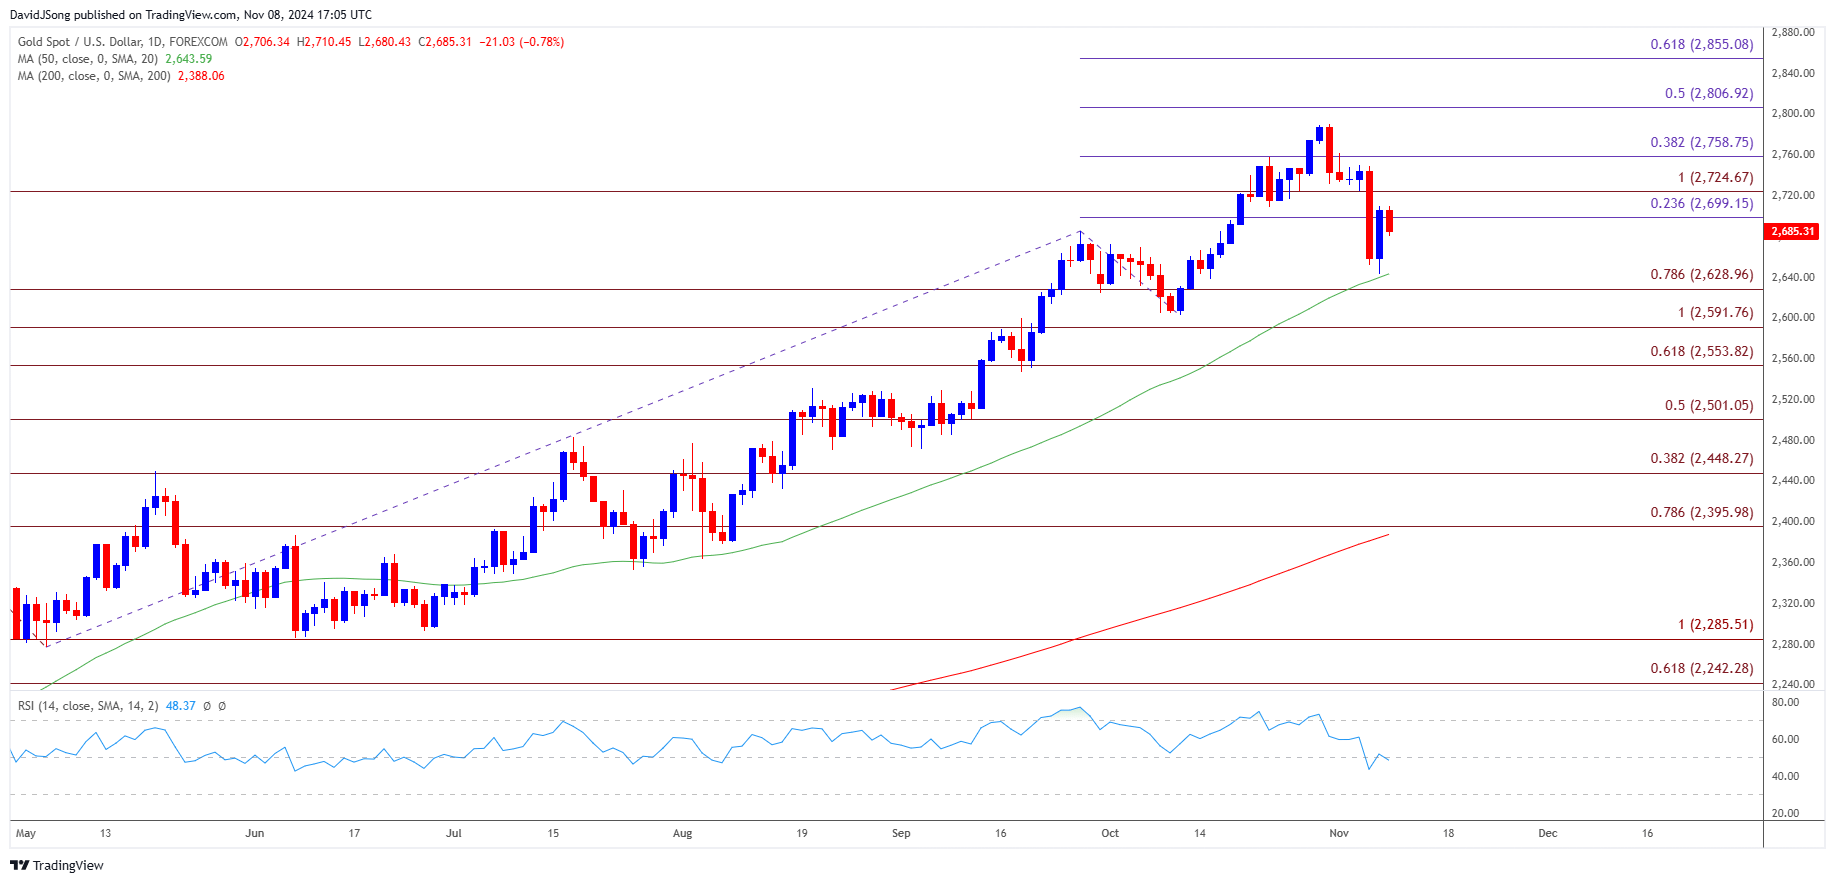
The price of gold is on course to weaken for the second consecutive week after showing a limited reaction to the Federal Reserve rate-cut, but bullion may continue to track the positive slope in the 50-Day SMA ($2644) as it holds above the moving average.
Gold Price Rebound Emerges Ahead of the 50-Day SMA
Keep in mind, the recent drop in the price of gold pushed the Relative Strength Index (RSI) to its lowest level since June, and the oscillator may continue to show the bullish momentum abating should it steadily move towards oversold territory.
Join David Song for the Weekly Fundamental Market Outlook webinar. David provides a market overview and takes questions in real-time. Register Here
Nevertheless, bullion may attempt to retrace the decline following the US election as the Federal Reserve delivers a dovish rate-cut in November, and it seems as though the Federal Open Market Committee (FOMC) will further unwind its restrictive policy as the central bank moves ‘toward a more neutral stance over time.’
In turn, the Fed may continue to prepare for US households and businesses for lower interest rates as Chairman Jerome Powell insists that ‘in the near term the election will have no effects on our policy decisions,’ and gold may continue to serve as an alternative to fiat-currencies amid the threat of a policy error.
With that said, the price of gold may continue to reflect a bullish trend as it appears to be bouncing ahead of the 50-Day SMA ($2644), but bullion may no longer tracks the positive slope in the moving average if it fails to retain the advance from the monthly low ($2644).
XAU/USD Price Chart – Daily

Chart Prepared by David Song, Strategist; XAU/USD on TradingView
- The price of gold may extend the decline from the start of the month as it struggles to trade back above the $2700 (23.6% Fibonacci extension) to $2730 (100% Fibonacci extension) region, with a breach below $2630 (78.6% Fibonacci extension) opening up the October low ($2603).
- Next area of interest comes in around $2590 (100% Fibonacci extension) but the price of gold may reestablish the bullish trend from earlier this year should it continue to track the positive slope in the 50-Day SMA ($2644).
- Need a close above the $2700 (23.6% Fibonacci extension) to $2730 (100% Fibonacci extension) region to bring $2760 (38.2% Fibonacci extension) on the radar, with a breach above the monthly high ($2762) raising the scope for a test of the yearly high ($2790).
Additional Market Outlooks
Monetary vs Fiscal Policy: Implications for FX Markets
USD/CAD Still Holds Below Monthly High Following Dovish Fed Rate Cut
GBP/USD Recovers Ahead of 200-Day SMA amid Hawkish BoE Rate Cut
US Dollar Forecast: USD/JPY Vulnerable to Looming Fed Rate Cut
--- Written by David Song, Senior Strategist
Follow on X at @DavidJSong


