Gold Price Outlook
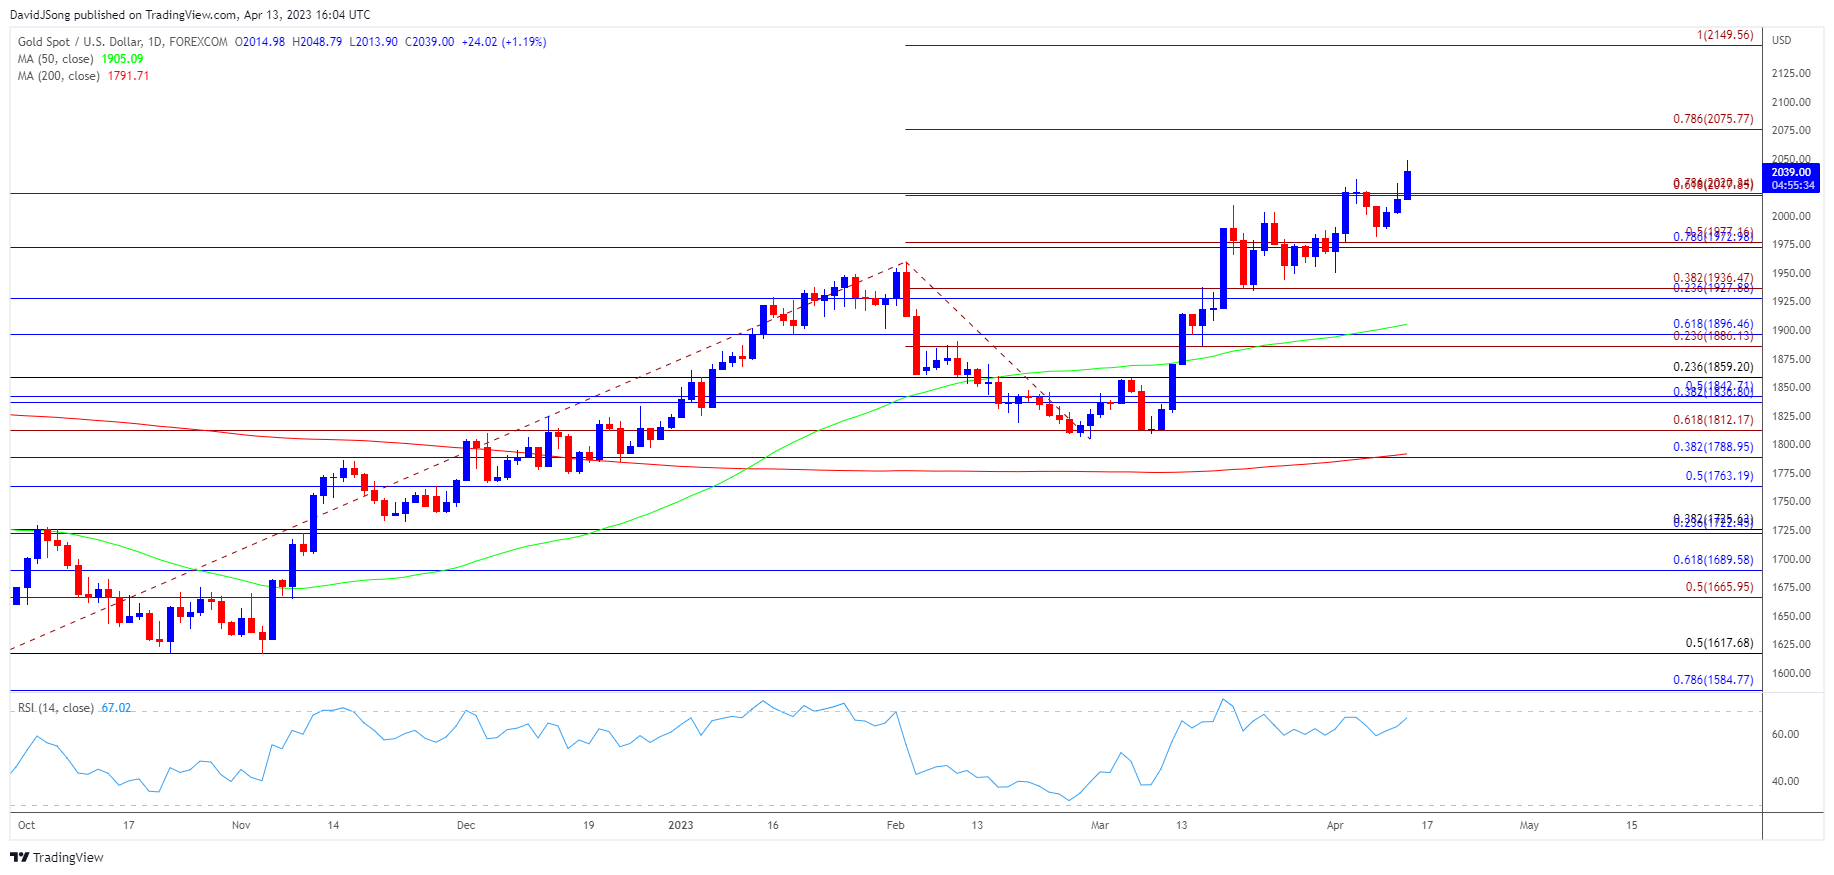
The price of gold clears the opening range for April to register a fresh yearly high ($2049), but the Relative Strength Index (RSI) appears to be diverging with price amid the failed attempts to push into overbought territory.
Gold price outlook mired by RSI divergence
The price of gold carves a series of higher highs and lows as the update to the US Consumer Price Index (CPI) generates a bullish reaction in bullion, and speculation for a looming change in regime may keep the precious metal afloat as the Federal Reserve appears to be at or nearing the end of its hiking-cycle.
Join David Song for the Weekly Fundamental Market Outlook webinar. Register Here

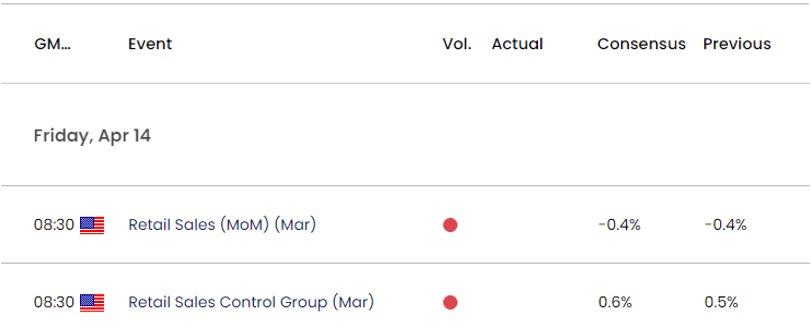
Looking ahead, the update to the US Retail Sales report may sway the Federal Open Market Committee (FOMC) as household spending is expected to contract 0.4% for the second straight month in March, and signs of a slowing economy may push the FOMC to alter the course for monetary policy as the minutes from the March meeting emphasize that ‘recent developments in the banking sector were likely to result in tighter credit conditions for households and businesses and to weigh on economic activity, hiring, and inflation.’
In turn, a growing number of Fed officials may start to endorse a wait-and-see approach as ‘many participants noted that the likely effects of recent banking-sector developments on economic activity and inflation had led them to lower their assessments of the federal funds rate target range,’ and it remains to be seen if the FOMC will continue to adjust the forward guidance at the next interest rate decision on May 3 as inflation remains well above the central bank’s 2% target.
Until then, data prints coming out of the US may continue to influence the price of gold as market participants brace for a change in regime, and bullion may continue to trade to fresh yearly highs as it clears the opening range for April.
With that said, the price of gold may stage further attempts to test the 2020 high ($2075) as the FOMC looks poised to switch gears later this year, but the Relative Strength Index (RSI) seems to be diverging with price as the oscillator struggles to push into overbought territory.
Gold Price Chart – XAU/USD Daily

Chart Prepared by David Song, Strategist; Gold Price on TradingView
- The price of gold registers a fresh yearly high ($2049) as it clears the opening range for April, with the 2020 high ($2075) in focus as bullion carves a series of higher highs and lows.
- A break above $2075 (78.6% Fibonacci extension) puts bullion in uncharted territory, with a move above 70 in the Relative Strength Index (RSI) likely to be accompanied by higher gold prices like the developments from earlier this year.
- Next area of interest comes in around $2150 (100% Fibonacci extension), but the RSI seems to be diverging with price amid the failed attempts to climb into overbought territory.
- Lack of momentum to test the 2020 high ($2075) may curb the recent series of higher highs and lows, with a move below the $2018 (61.8% Fibonacci extension) to $2020 (78.6% Fibonacci extension) region bringing the $1973 (78.6% Fibonacci retracement) to $1977 (50% Fibonacci extension) area back on the radar.
--- Written by David Song, Strategist
Follow me on Twitter at @DavidJSong


