Gold Price Outlook
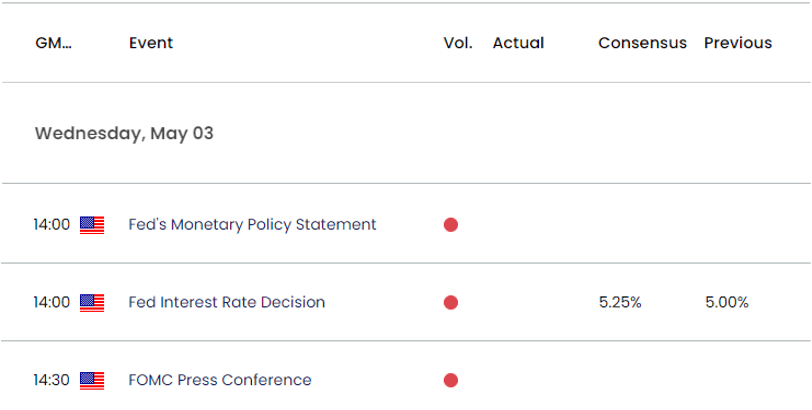
The price of gold snaps the series of higher highs and lows from the start of the week as the US Gross Domestic Product (GDP) report reveals a stronger-than-expected reading for inflation, but bullion may face range bound conditions ahead of the Federal Reserve interest rate decision as it bounces back from the weekly low ($1974).
Gold price forecast: XAU/USD outlook hinges on Fed rate decision
The price of gold continues to trade in a defined range following the failed attempt to test the 2020 high ($2075), and it remains to be seen if the Federal Open Market Committee (FOMC) will respond to the 1Q GDP report as the update shows the core Personal Consumption Expenditure (PCE), the Fed’s preferred gauge for inflation, climbing to 4.9% from 4.4% the previous quarter.
Join David Song for the Weekly Fundamental Market Outlook webinar. Register Here

The development may push the FOMC to pursue a more restrictive policy as inflation remains well above the central bank’s 2% target, and Chairman Jerome Powell and Co. may deliver a hawkish rate hike especially as the US labor market remains ‘very tight.’
In turn, the price of gold may struggle to hold its ground in May if the Fed prepares US households and businesses for higher interest rates, but a shift in the FOMC’s forward guidance may heighten the appeal of bullion should the committee show a greater willingness to change gears later this year.
With that said, the reaction to the Fed rate decision may define the near-term outlook for bullion as the ongoing hiking-cycle fuels fears of a policy error, and the price of gold may continue to face range bound conditions going into May as it bounces back from the weekly low ($1974).
Gold Price Chart – XAU/USD Daily

Chart Prepared by David Song, Strategist; Gold Price on TradingView
- The price of gold continues to consolidate following the failed attempt to test the 2020 high ($2075), and bullion may face range bound conditions going into May as it bounces back from the weekly low ($1974).
- Failure to break/close below the $1973 (78.6% Fibonacci retracement) to $1977 (50% Fibonacci extension) area may push the price of gold back towards the $2018 (61.8% Fibonacci extension) to $2020 (78.6% Fibonacci extension) region as the 50-Day SMA ($1931) continues to reflect a positive slope.
- Need a break above the monthly high ($2049) to bring $2075 (78.6% Fibonacci extension) back on the radar, but lack of momentum to clear the $2018 (61.8% Fibonacci extension) to $2020 (78.6% Fibonacci extension) region may keep the price of gold within a defined range.
Additional Resources:
AUD/USD tumbles toward March low following 'Death Cross' formation
EUR/USD forecast: April 2022 high back on radar
--- Written by David Song, Strategist


