Gold Technical Forecast: XAU/USD Weekly Trade Levels
- Gold plunges 7% off record highs- attempting to snap three-week losing streak
- Risk for deeper correction remains – broader outlook remains constructive
- Gold resistance 2024/35 (key), 2075/81, 2149 – support 1943, 1926, 1891-1903 (critical)
Gold prices are attempting to snap a three-week losing streak with XAU/USD now testing multi-month uptrend support. The focus is on a possible exhaustion low in the weeks ahead and while the broader outlook remains constructive, the threat for a deeper pullback still looms heading into the June open. These are the updated targets and invalidation levels that matter on the XAU/USD weekly technical chart.
Review my latest Weekly Strategy Webinar for an in-depth breakdown of this crude oil setup and more. Join live on Monday’s at 8:30am EST.
Gold Price Chart – XAU/USD Weekly

Chart Prepared by Michael Boutros, Technical Strategist; XAU/USD on TradingView
Technical Outlook: In my last Gold Weekly Price Forecast we offered evidence of a possible medium-term top in XAU/USD after, “another failed attempt to mount the record high with a close back below the record 2020 high-close at 2035 once again threatening topside exhaustion in XAU/USD.” We specifically noted support at, “the objective January high at 1959 backed by the April high-week reversal close at 1926- losses should be limited to this threshold IF price is heading higher on this stretch.”
Gold plunged more than 7% off those highs with a three-week decline now testing confluent support around the 50% retracement / 2022 channel at ~1943 (intraday low registered at 1932). The focus now shifts on a possible exhaustion low heading into the start of June.
Initial resistance eyed with the median-line (currently ~1975s) backed by a key technical confluence at the 61.8% Fibonacci retracement of the recent decline / 2020 high-week / record high-close at 2024/35- a breach / close above this threshold would be needed to mark resumption of the broader uptrend towards the record highs at 2075/81.
A break below this support level would threaten a deeper correction towards 1926 with broader bullish invalidation steady at 1891-1903- a region defined by the May 2021 high week close and the 38.2% retracement of the entire September rally. Both levels represent areas of interest for possible downside exhaustion IF reached.
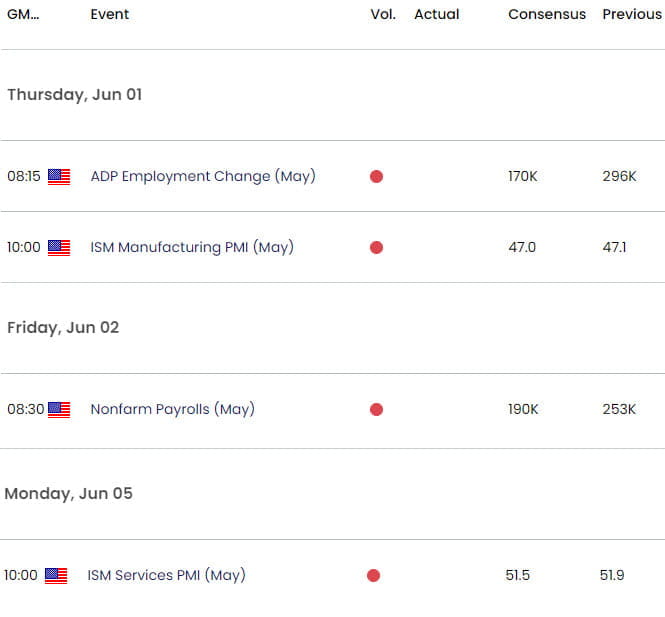
Bottom line: Gold is testing multi-month uptrend support and we’re looking to validate a possible low in the weeks ahead. From a trading standpoint, a good zone to reduce short-exposure / lower protective stops – ultimately, losses should be limited to 1891 IF price is heading higher with a close above 2034 needed to mark uptrend resumption. Keep in mind we have US Non-Farm Payroll on tap into the close of the week with the FOMC rate decision looming – tread lightly into the June open. Review my latest Gold short-term technical outlook for a closer look at the near-term XAU/USD technical trade levels.
Key Economic Data Releases

Economic Calendar - latest economic developments and upcoming event risk.
Active Weekly Technical Charts
- Crude Oil (WTI)
- Canadian Dollar (USD/CAD)
- S&P 500, Nasdaq, Dow Jones
- Euro (EUR/USD)
- Japanese Yen (USD/JPY)
- Australian Dollar (AUD/USD)
- US Dollar (DXY)
- British Pound (GBP/USD)
--- Written by Michael Boutros, Sr Technical Strategist with FOREX.com
Follow Michael on Twitter @MBForex


