Gold, XAU/USD Talking Points:
- Last month’s ECB rate cut announcement helped to drive a bullish breakout in Gold beyond the $2530 level and buyers never looked back, not allowing for a re-test of support at that prior resistance.
- While gold is often priced in USD and considered to be the ‘anti dollar,’ DXY is really a composite of underlying currencies, with 57.6% being the Euro. More signal of softening from the ECB could give gold bulls another reason to push forward.
- I’ll be going over gold in-depth in tomorrow’s webinar: Click here for registration information.
Going into last month’s ECB announcement, the bullish trend in gold had stalled for a few weeks. Resistance was well-defined at 2530 but leading into that rate decision, there was a build of higher-lows leading to an ascending triangle.
Once the ECB announced the rate cut, bulls drove the breakout and price never really looked back, with the rally continuing until the 2600 test on the afternoon of the FOMC rate cut announcement. From that, a pullback did develop, albeit short-lived, that allowed for a 2550 support test before the breakout extended.
As global central banks push into dovish postures, gold bulls have had even more reason to press. The current bullish backdrop in gold got started in March, right around when the Fed started to sound dovish and as if rate hikes were in the rear view, with the next move from the bank then expected to be a cut. Since then, bulls haven’t really calmed down and it was in April when gold went overbought on the monthly chart, a feature which remains in-place today.
At this point, there’s no sign of the run being over and as such, this can make the prospect of bearish biases or counter-trend expectations as a challenge. But, on the same note, just buying and hoping for extension aren’t great strategies, either.
Gold Weekly Price Chart
 Chart prepared by James Stanley; data derived from Tradingview
Gold Overbought Weekly, Monthly
It was a few weeks ago now that I pointed out that gold was overbought on all of the daily, weekly and monthly charts; but as the title pointed out, the big question was whether that mattered? And for near term price action, it has not so far and one of the dangers of contrarian stances on the basis of an oscillator is the fact that, often, price can get even more overbought (or oversold in bearish cases).
But this also does not mean that bulls are without option, as there’ve been a number of shorter-term pullbacks that have allowed for trend continuation, even if buyers have continued to stumble upon re-tests of prior highs. We saw another last week, and I had highlighted as much in these articles and the accompanying video, with buyers holding support above the prior resistance level of 2600.
Before that, there was another episode and perhaps ironically, it was right after the Fed’s rate cut announcement. The FOMC cut by 50 bps and that brought upon the first ever test of the 2600 level in spot. And then a fast and heavy sell-off showed for the next hour, until bulls showed up to hold support at 2550.
Notably, that 2550 support was about $20 above prior resistance of 2530, and this again exudes the anticipation that buyers have been showing, similar to last week, when they wouldn’t even allow for price to stretch down for a re-test of prior highs before buyers crowded the bid.
Gold Four-Hour Price Chart
 Chart prepared by James Stanley; data derived from Tradingview
Gold Supports
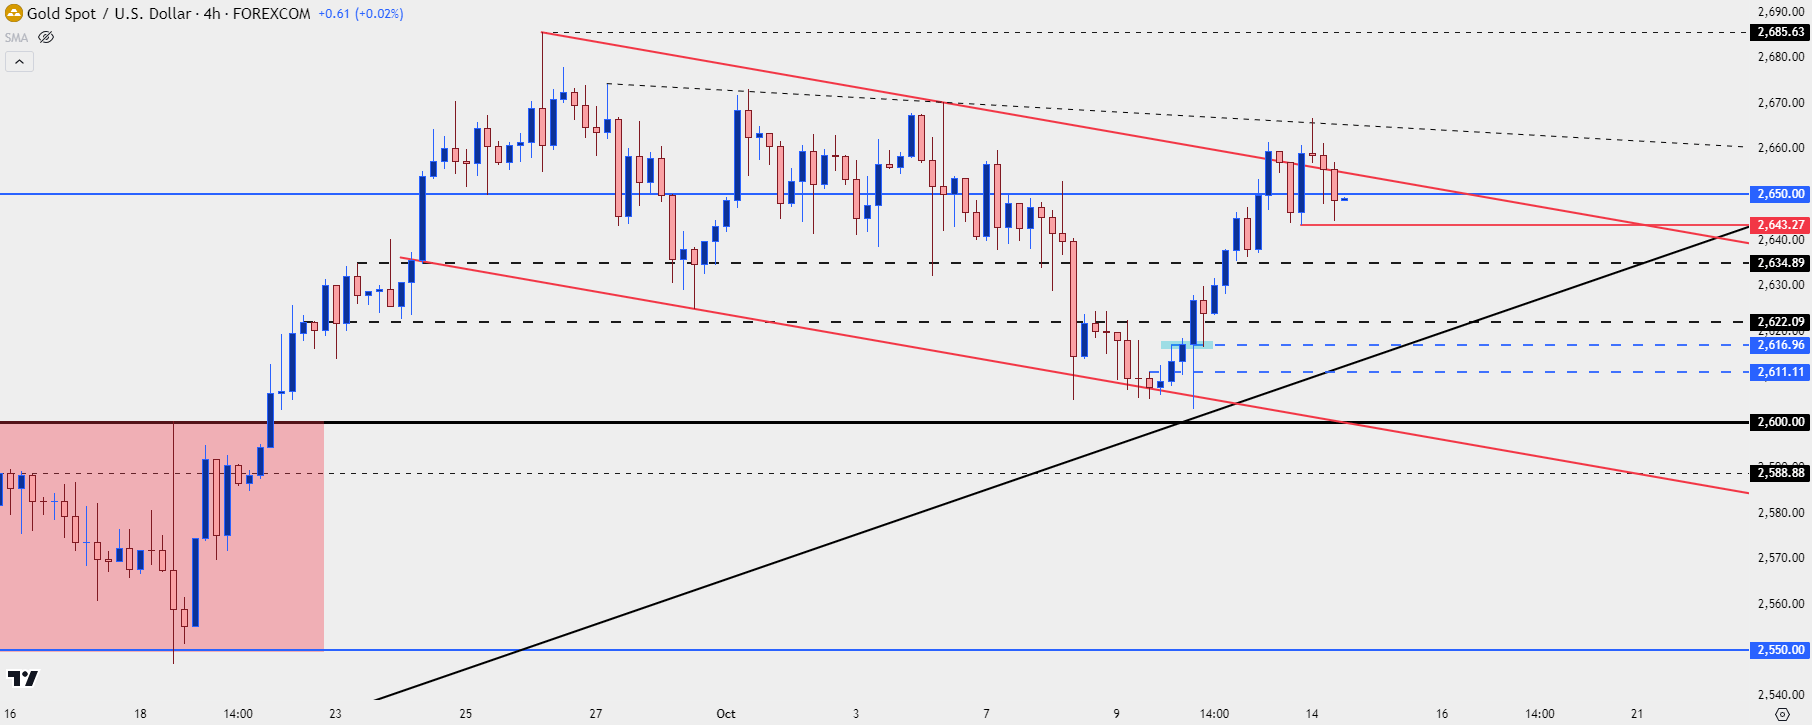
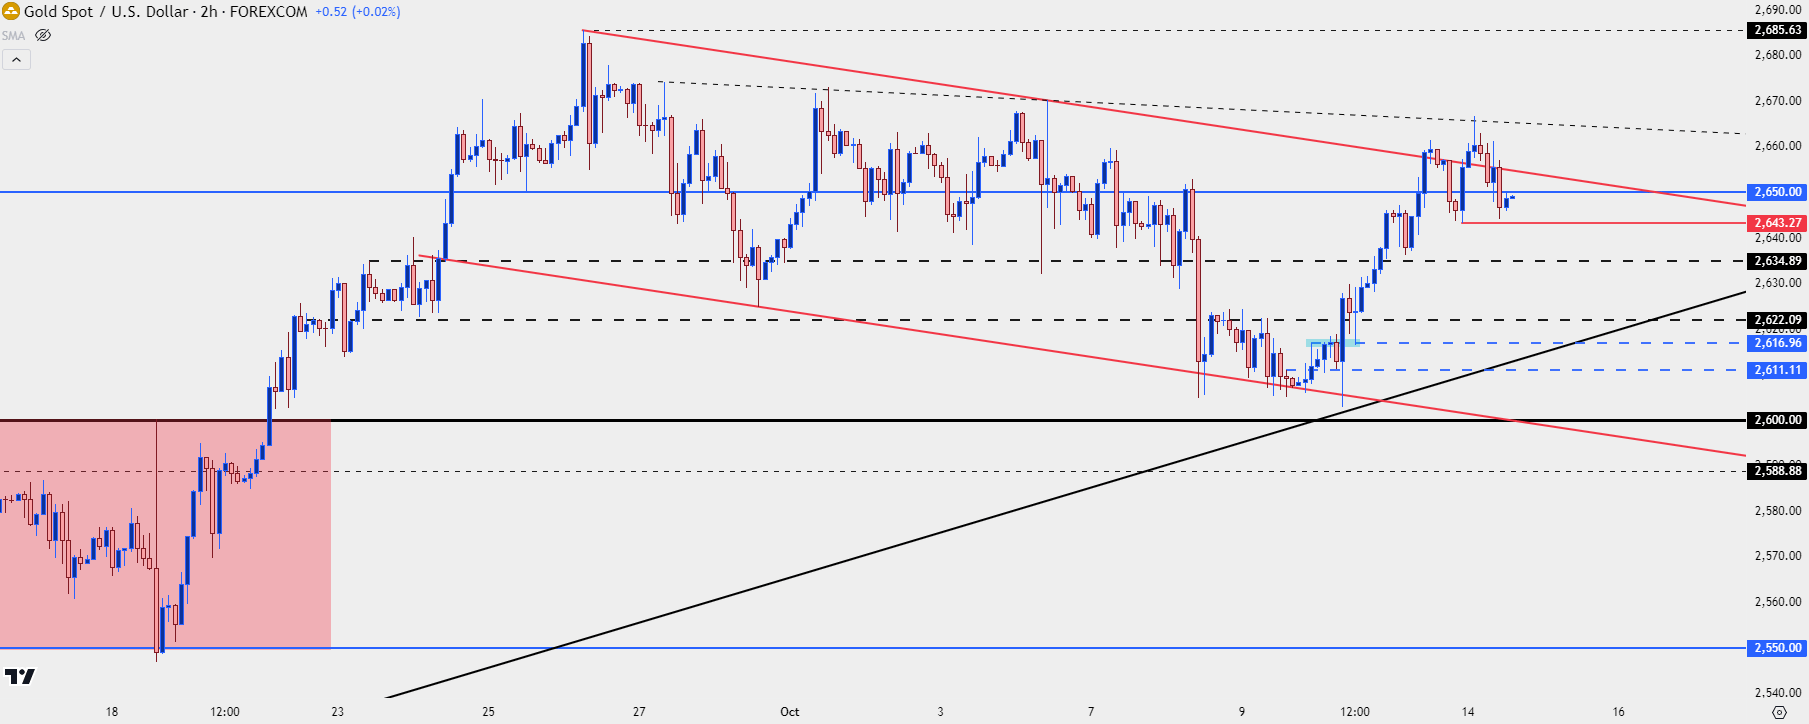
At this point buyers remain restrained by the resistance side of the bull flag formation. There was a test of a break last week but, so far, bulls have failed to push through. In my estimation it’s the 2700 psychological level that’s taking a toll as we saw bulls shy away from a test in late-September and, since then, it’s been lower-highs.
At this point I’m tracking the same 2635 level that was resistance after the post-FOMC breakout, with the 2622 level just inside of that. The same 2616 level that came into play last Thursday could also be of interest but, if bulls can’t hold that, then we’d have a breach in the sequence of higher-highs and higher-lows, and that would point to the possibility of a re-test of the 2600 level, which is something that buyers haven’t allowed for since the post-FOMC breakout.
Gold Two-Hour Price Chart
 Chart prepared by James Stanley; data derived from Tradingview
--- written by James Stanley, Senior Strategist


