US Dollar Outlook: GBP/USD
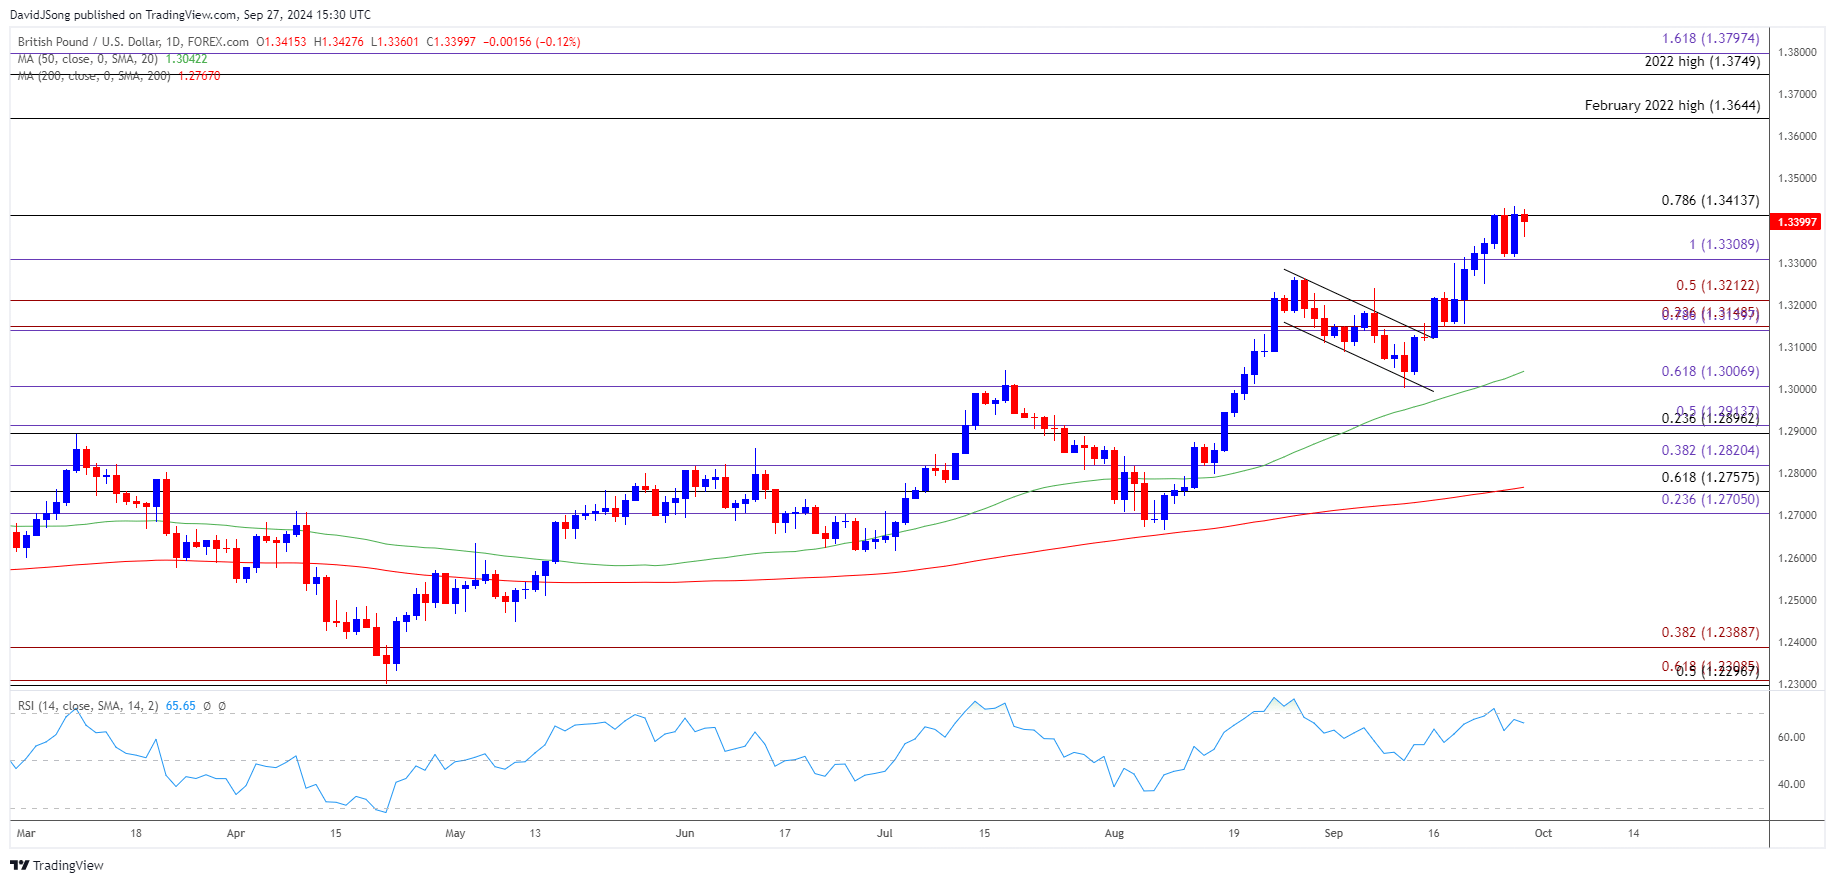
GBP/USD trades in a narrow range after breaking out of a bull-flag formation, but the exchange rate may attempt to test the February 2022 high (1.3644) as it appears to be tracking the positive slope in the 50-Day SMA (1.3042).
GBP/USD Bull-Flag Breakout Fizzles to Keep RSI Below 70
GBP/USD trades near the monthly high (1.3434) as the US Personal Consumption Expenditure (PCE) Price Index narrows to 2.2% in August from 2.5% per annum the month prior, with the update also showing the gauge for Personal Income increasing 0.2% during the same period versus forecasts for a 0.4% print.
Signs of easing inflation may encourage the Federal Reserve to carry out a rate-cutting cycle as the central bank ‘projects that the appropriate level of the federal funds rate will be 4.4 percent at the end of this year,’ and the US Dollar may face headwinds ahead of the next rate decision on November 7 as Chairman Jerome Powell and Co. move towards a neutral policy.
Join David Song for the Weekly Fundamental Market Outlook webinar. David provides a market overview and takes questions in real-time. Register Here
With that said, GBP/USD may continue to register fresh yearly highs over the remainder of 2024 as it reflects a bullish trend, but the exchange rate may consolidate over the coming days as the Relative Strength Index (RSI) struggles to push back into overbought territory.
GBP/USD Price Chart –Daily

Chart Prepared by David Song, Strategist; GBP/USD on TradingView
- The bull-flag formation in GBP/USD seems to have run its course as the exchange rate struggles to hold above 1.3410 (78.6% Fibonacci retracement), and a move below 1.3310 (100% Fibonacci extension) may keep the Relative Strength Index (RSI) below 70.
- A break/close below 1.3210 (50% Fibonacci extension) brings the 1.3140 (78.6% Fibonacci extension) to 1.3150 (23.6% Fibonacci extension) region on the radar, with the next area of interest coming in around the monthly low (1.3002).
- Nevertheless, GBP/USD may track the positive slope in the 50-Day SMA (1.3042) as it holds above the moving average, and a move above 70 in the RSI is likely to be accompanied by a further advance in the exchange rate like the price action from earlier this year.
- In turn, GBP/USD may attempt to test the February 2022 high (1.3644), with the next area of interest coming in around the 2022 high (1.3749).
--- Written by David Song, Senior Strategist
Follow on Twitter at @DavidJSong


