US Dollar Outlook: EUR/USD
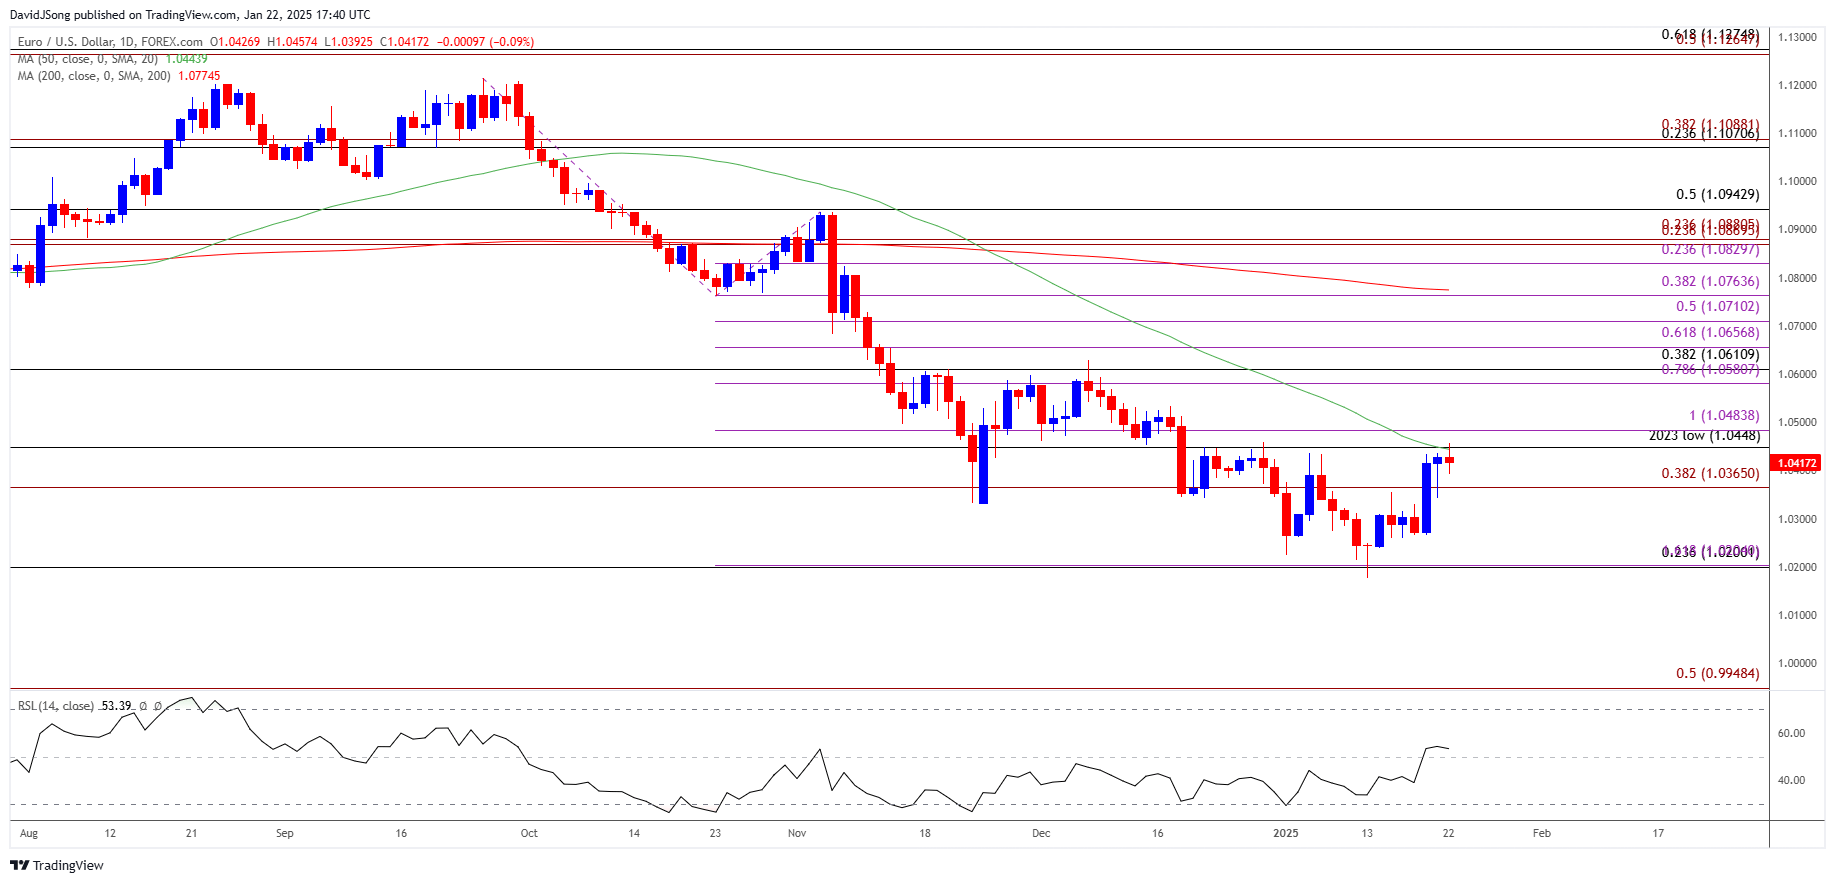
EUR/USD pushes above the 50-Day SMA (1.0444) for the first time since October as it climbs to a fresh monthly high (1.0457), but the recent advance in the exchange rate may turn out to be temporary should it struggle to close above the moving average.
EUR/USD Pushes Above 50-Day SMA for First Time Since October
EUR/USD extends the rally from the start of the week to push the Relative Strength Index (RSI) to its highest level since September, and the exchange rate may no longer track the negative slope in the moving average amid the break above the opening range for January.
Join David Song for the Weekly Fundamental Market Outlook webinar.
David provides a market overview and takes questions in real-time. Register Here
However, the Euro may face headwinds ahead of the European Central Bank (ECB) meeting on January 30 as Vice-President Luis de Guindos acknowledges that ‘the balance of macroeconomic risks has shifted from concerns about high inflation to concerns about low growth’ while speaking at the 15th Spain Investors Day.
Vice-President Guindos went on to say that ‘if the incoming data confirm our baseline, the policy trajectory is clear, and we expect to continue to further reduce the restrictiveness of monetary policy,’ and the comments suggest the ECB will implement lower interest rates in 2025 amid the progress in bringing down inflation towards its 2% target.
With that said, speculation surrounding the ECB rate decision may sway EUR/USD over the coming days, but the exchange rate may attempt to further retrace the decline from the December high (1.0630) should it no longer track the negative slope in the 50-Day SMA (1.0444).
EUR/USD Chart – Daily

Chart Prepared by David Song, Senior Strategist; EUR/USD on TradingView
- EUR/USD pushes above the opening range for January as it carves a series of higher highs and lows, with a break/close above the 1.0448 (2023 low) to 1.0480 (100% Fibonacci extension) zone bringing the 1.0580 (78.6% Fibonacci extension) to 1.0610 (38.2% Fibonacci extension) region on the radar.
- Next area of interest comes in around the December high (1.0630), but EUR/USD may continue to track the negative slope in the 50-Day SMA (1.0444) should it struggle to close above the moving average.
- Need a move below 1.0370 (38.2% Fibonacci extension) for EUR/USD to threaten the bullish price series, with a close below 1.0200 (23.6% Fibonacci retracement) raising the scope for a move towards parity.
Additional Market Outlooks
USD/JPY Slips to Fresh Monthly Low Ahead of BoJ Rate Decision
USD/CAD Spikes to Fresh Monthly High as Trump Prepares Canada Tariff
GBP/USD Pullback Pushes RSI Toward Oversold Territory
AUD/USD Vulnerable amid Struggle to Push Above Weekly High
--- Written by David Song, Senior Strategist
Follow on Twitter at @DavidJSong


