US Dollar Outlook: EUR/USD
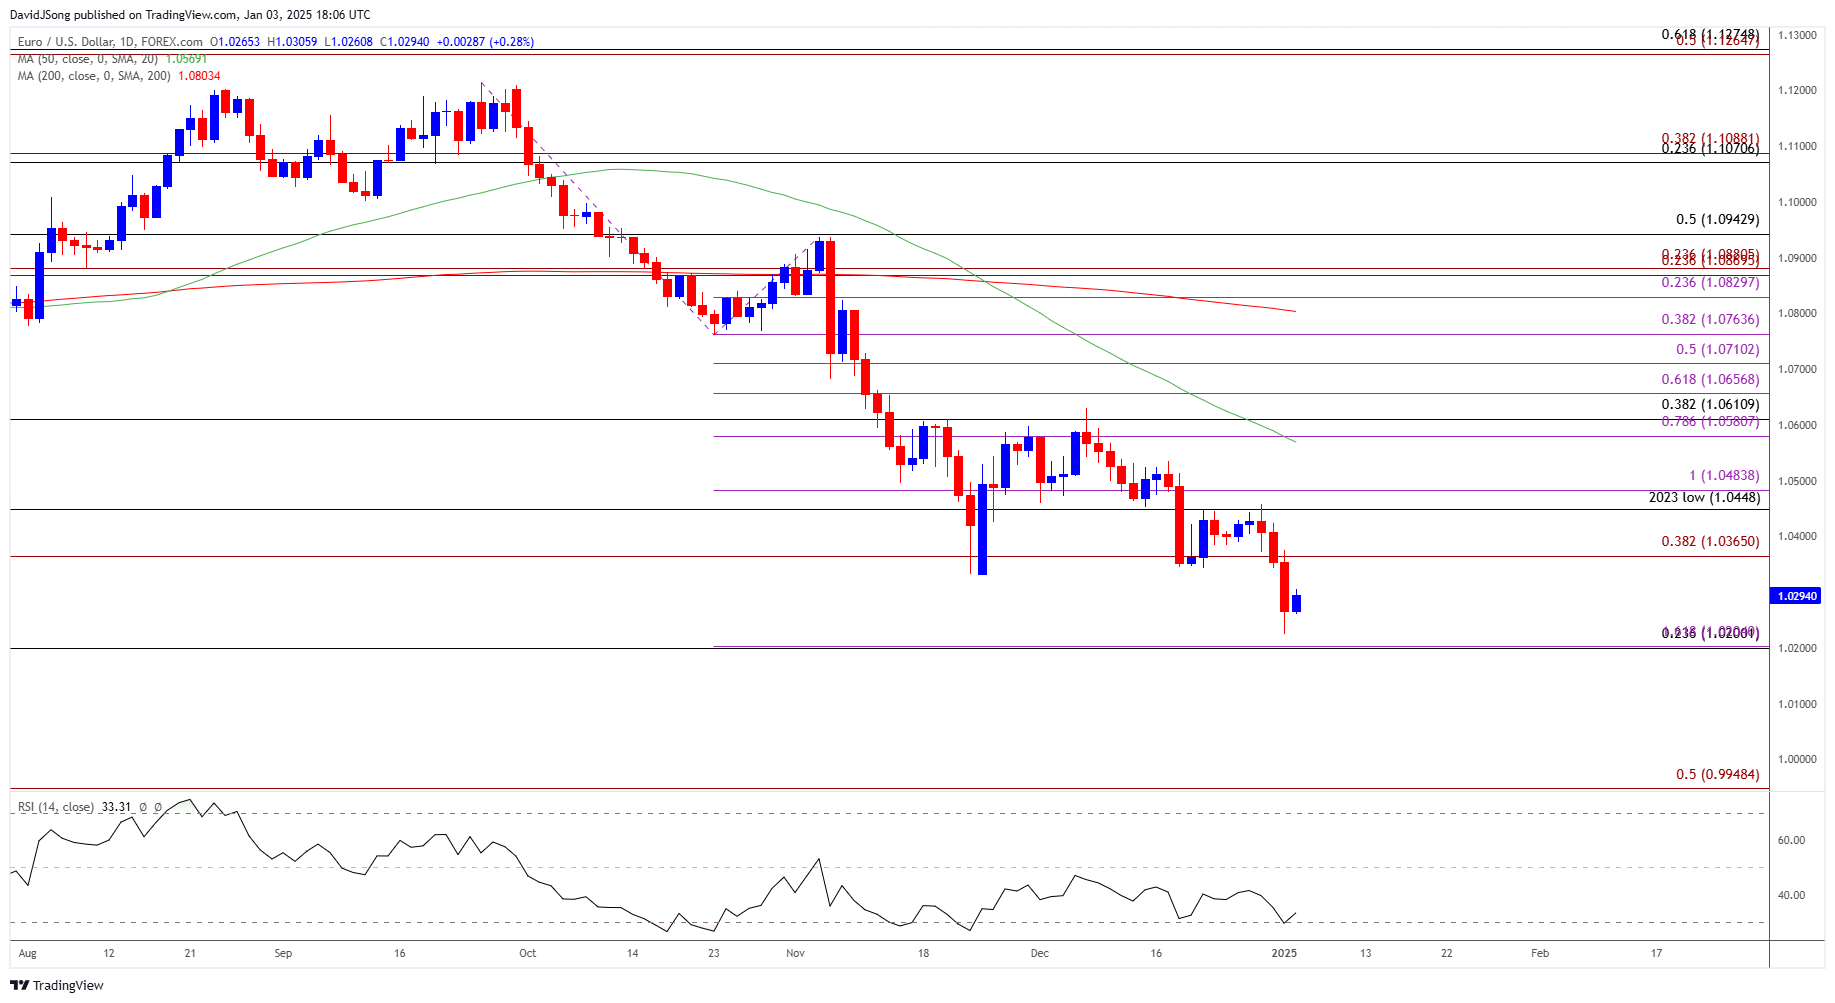
EUR/USD halts a three-day selloff to keep the Relative Strength Index (RSI) out of oversold territory, but a move below 30 in the oscillator is likely to be accompanied by a further decline in the exchange rate like the price action from last year.
EUR/USD Halts Three-Day Selloff to Keep RSI Out of Oversold Territory
Keep in mind, EUR/USD failed to defend the November low (1.0333) as it struggled to retrace the weakness following the US election, and the exchange rate may continue to track the negative slope in the 50-Day SMA (1.0569) as it holds below the moving average.
Join David Song for the Weekly Fundamental Market Outlook webinar.
David provides a market overview and takes questions in real-time. Register Here
In turn, the rebound in EUR/USD may turn out to be temporary, but the exchange rate may consolidate during the first full week of January amid the limited reaction to the US ISM Manufacturing survey, which showed the index widening to 49.3 in December from 48.4 the month prior.
With that said, the opening range for 2025 is in focus for EUR/USD as it no longer carves a series of lower highs and lows, but the RSI may show the bearish momentum gathering pace if it falls below 30 and pushes into oversold territory.
EUR/USD Chart – Daily

Chart Prepared by David Song, Senior Strategist; EUR/USD on TradingView
- EUR/USD bounces back ahead of 1.0200 (23.6% Fibonacci retracement) to keep the Relative Strength Index (RSI) above 30, with a move back above 1.0370 (38.2% Fibonacci extension) bringing the 1.0448 (2023 low) to 1.0480 (100% Fibonacci extension) zone back on the radar.
- Next area of interest comes in around 1.0580 (78.6% Fibonacci extension) to 1.0610 (38.2% Fibonacci retracement), but EUR/USD may struggle to retain the rebound from the weekly low (1.0224) as it appears to be tracking the negative slope in the 50-Day SMA (1.0569).
- Failure to hold above 1.0200 (23.6% Fibonacci retracement) may push EUR/USD towards parity, with the next area of interest coming in around 0.9950 (50% Fibonacci extension).
Additional Market Outlooks
USD/CAD Rebound Pushes RSI Back Towards Overbought Zone
British Pound Forecast: GBP/USD Pushes Below May Low to Eye 2024 Low
AUD/USD Vulnerable to Change in RBA Policy
US Economy Proves Stronger-Than-Expected in 2024
--- Written by David Song, Senior Strategist
Follow on Twitter at @DavidJSong


