Euro, EUR/USD, US Dollar Talking Points:
- When I looked at the USD in the Tuesday webinar, I highlighted the still bullish structure on the DXY daily chart. That bounce extended but notably EUR/USD hasn’t yet taken out yesterday’s higher-low.
- EUR/USD bears pulled up just shy of a key Fibonacci level last week, which plots at the 1.0200 handle. That move around the 2025 open did establish fresh two-year-lows for the pair. Below that, it’s parity that stands out as important.
- I look at both EUR/USD and the U.S. Dollar in-depth during each Tuesday webinar, and you’re welcome to join the next one. Click here for registration information.
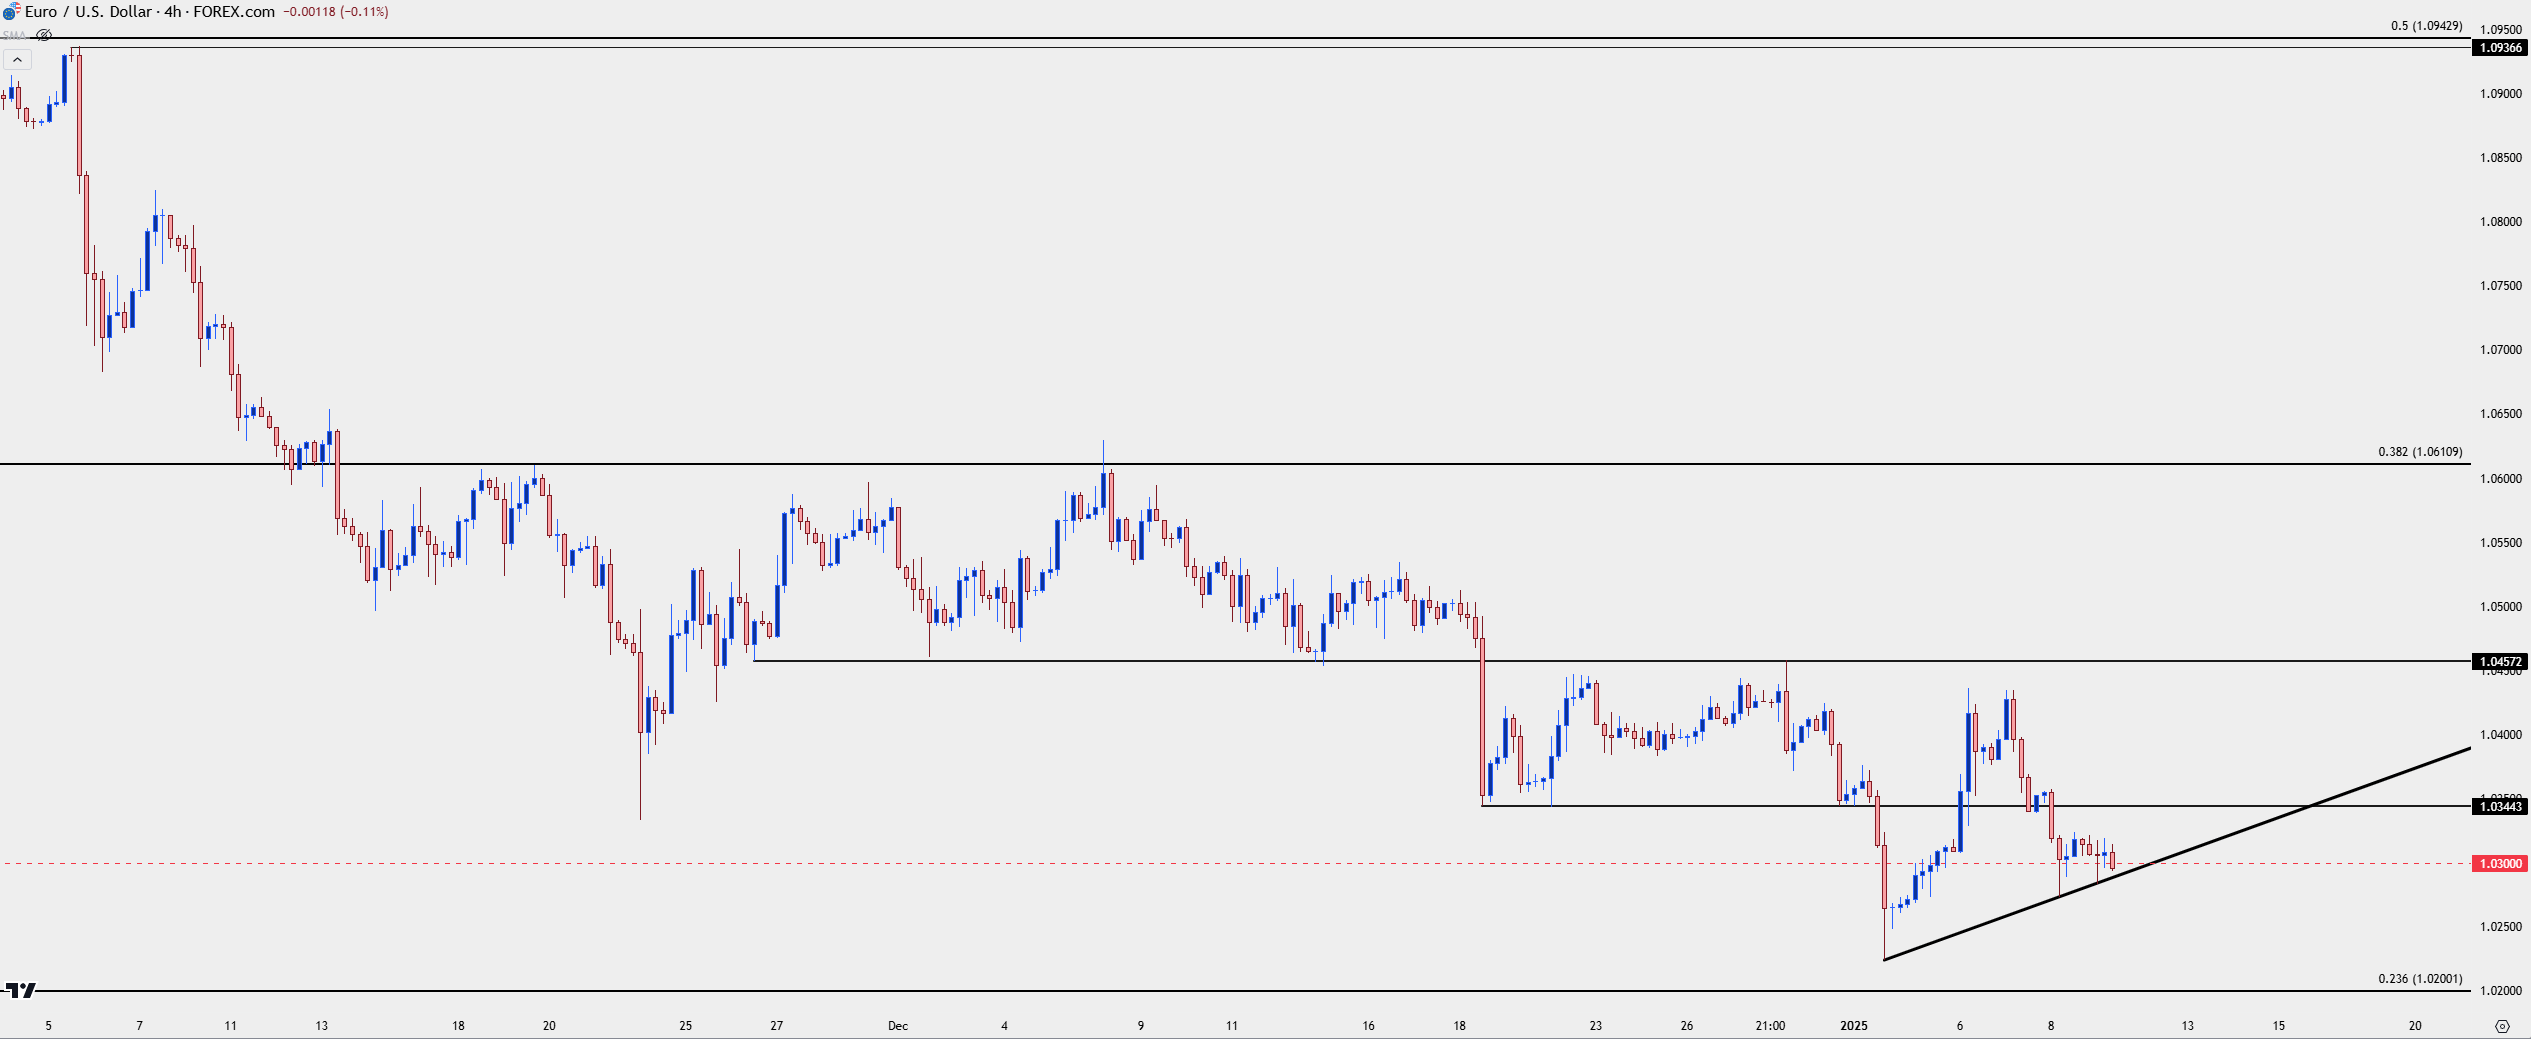
EUR/USD is testing below the 1.0300 level as of this writing and there’s also a trendline of note sitting just below, which connects last week’s and this Wednesday’s swing-low as sellers have, so far, been unable to test the 1.0200 Fibonacci level sitting just below recently-established two-year-lows in the pair.
EUR/USD Four-Hour Price Chart
 Chart prepared by James Stanley, EUR/USD on Tradingview
EUR/USD 1.0200
On a longer-term basis this is a tough move to chase. That’s not to say that there hasn’t been pullback or two-way price action, because there has; it just hasn’t been the case for about a month now.
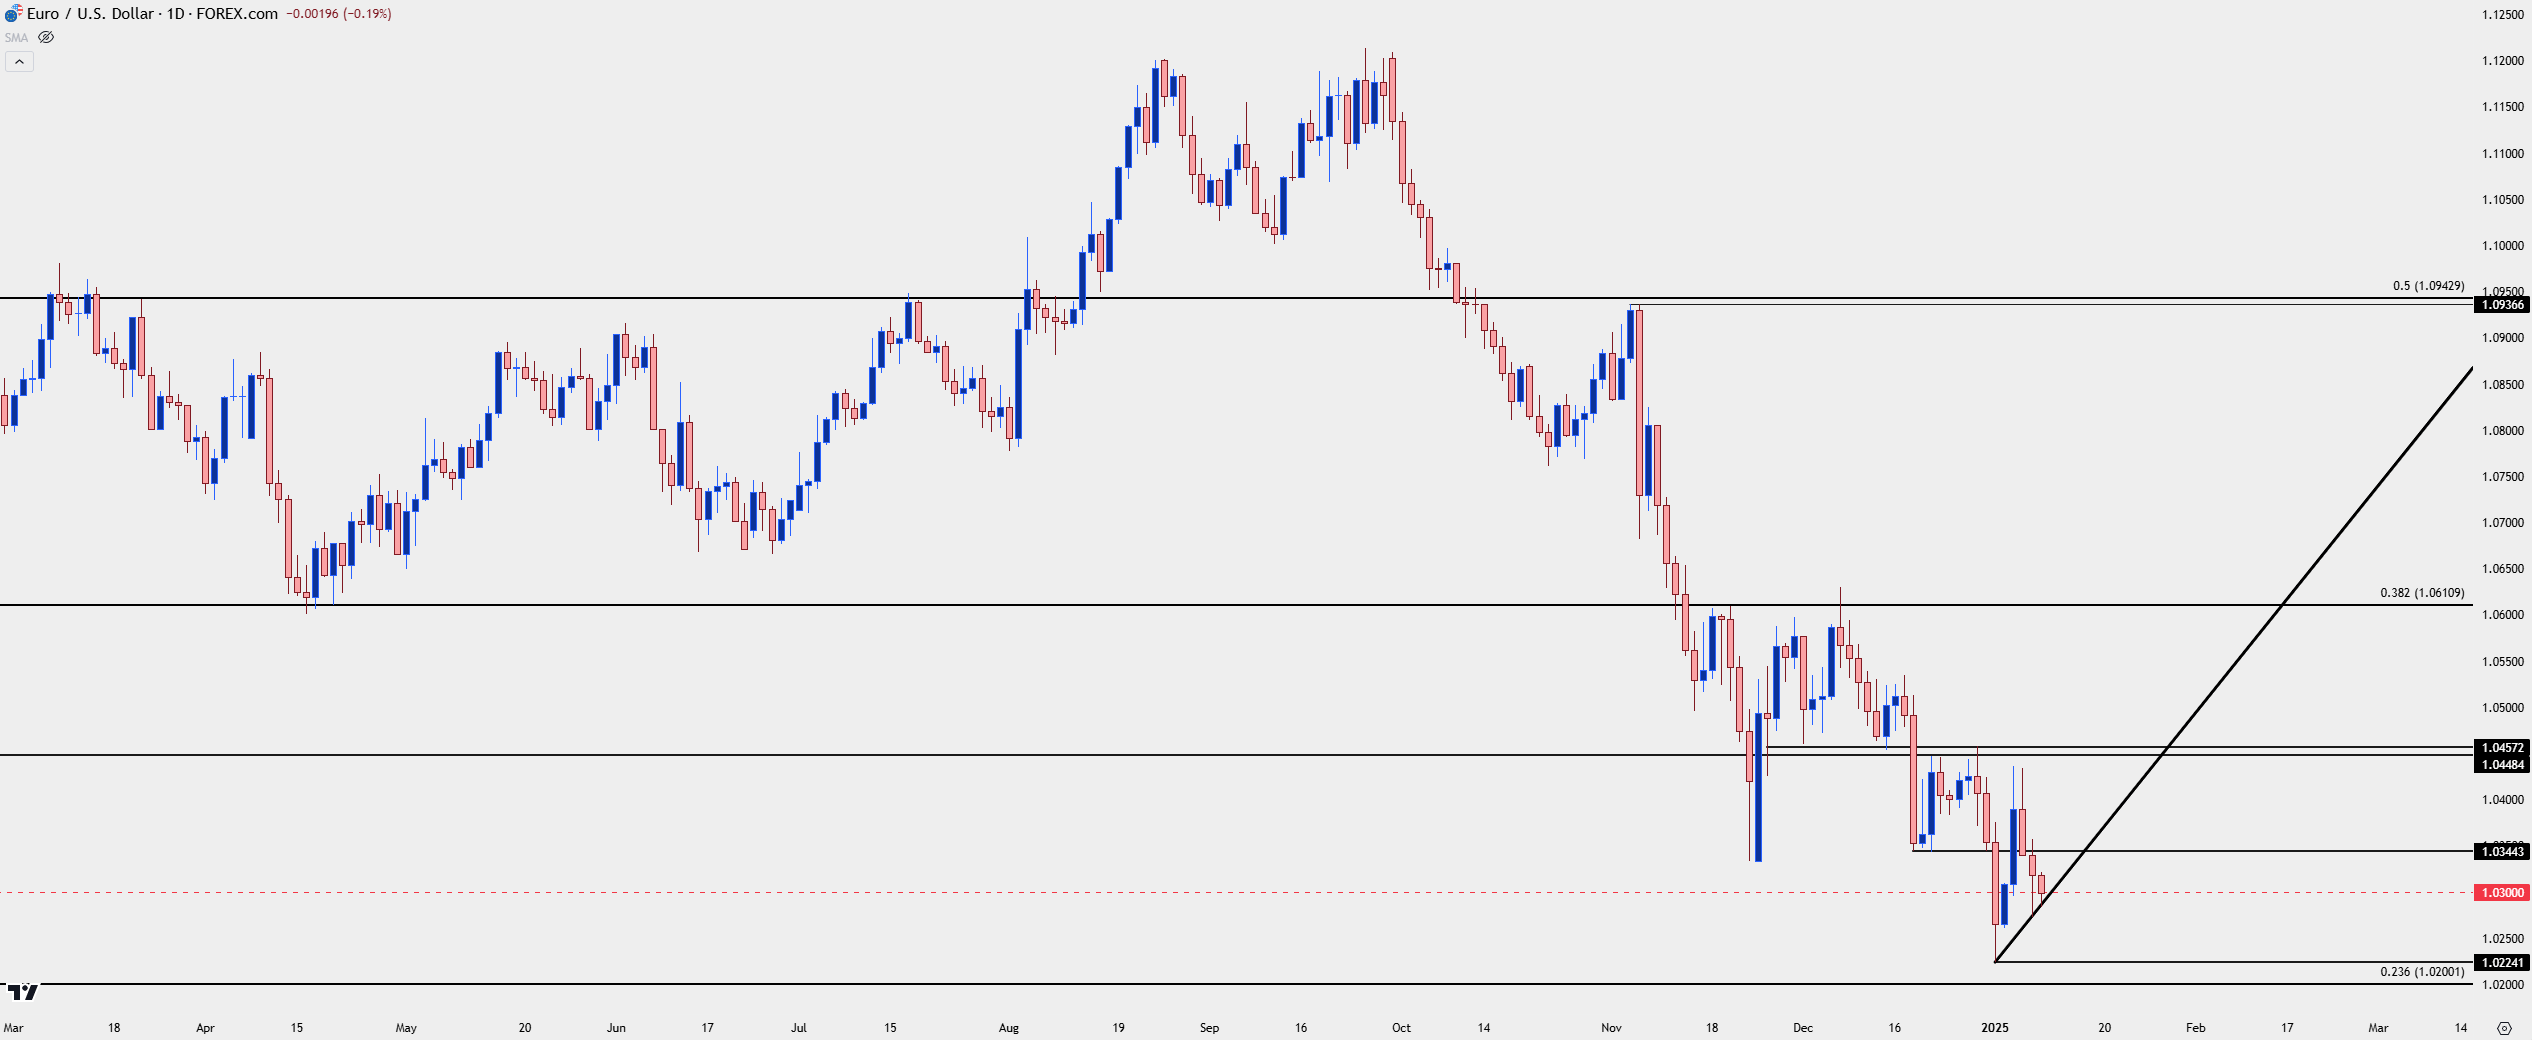
In early-December EUR/USD was pulling back until it tested a key level at 1.0611 on the morning of NFP. That level helped to set the high and sellers came back in with aggression, forcing a break back-below 1.0500 and, eventually, the fresh two-year-lows that printed in early-2025 trade.
But that 1.0611 level is important, as this is the 38.2% Fibonacci retracement of the 2021-2022 major move. That price had previously helped to set support in the first-half of last year before becoming resistance in December; and the 61.8% retracement of that same Fibonacci setup marked the high in 2023 at 1.1275.
The 23.6% retracement from that same Fibonacci study plots at 1.0200 and, so far, this hasn’t come into the picture as bulls showed up 24 pips above that psychological level. But – if sellers can stretch the current move and given the Friday NFP report on the calendar for tomorrow, there could be motivation for a scenario like that to show, that price becomes a level of interest in a few different ways.
If sellers can’t substantiate significant trend-side drive below that price, it could be a point of interest for reversal scenarios, particularly if it leads into a build of shorter-term higher-lows.
EUR/USD Daily Chart
 Chart prepared by James Stanley, EUR/USD on Tradingview
EUR/USD Bigger Picture
It’s the bigger picture that’s of interest for mean-reversion, in my opinion. RSI on the weekly chart is currently showing in oversold territory. That can change, of course, as there’s still a little more than a full day left for this week. RSI had similarly showed as oversold for one weekly bar back in November, around the time that the pair put in the initial break-below 1.0500, which then led to the pullback to 1.0611 in early-December.
Oversold RSI doesn’t mean that price has to pullback, however, as we can see from the instances in 2021 and 2022 when the indicator continually printed in oversold territory as the EUR/USD sell-off extended.
But – there is a major difference between that scenario and the current, which draws back to the representative Central Banks. Back in 2021 and 2022, there was a growing chasm between Fed and ECB policy, with the Fed pushing 75 bp hikes as of June 22 which helped to drive the EUR/USD’s first ever test below parity.
And for now – the Fed still sounds somewhat dovish, even if less so than they sounded in September of last year. Again, this can change but it’s also what puts so much importance on data, starting with tomorrow’s NFP report and then extending to next Wednesday’s CPI report. Softness in U.S. data could help to settle those fears of growing divergence between the ECB and the Fed and, in-turn, help to drive some short-cover in the EUR/USD bearish trend.
EUR/USD Weekly Chart
 Chart prepared by James Stanley, EUR/USD on Tradingview
--- written by James Stanley, Senior Strategist


