- Treasury moves, not Nvidia or geopolitical headlines, drive EUR/USD and GBP/USD price action
- Both pairs whipsawed as yields rose, with technical signals offering mixed clues.
- Momentum favours buying dips, but US yields remain the key driver for now
Overview
The headlines may have been dominated by Nvidia’s pre-earnings share price drama and speculation over missile origins in Ukraine, but for forex traders, the real story on Wednesday was at the long end of the Treasury curve. Moves in US yields likely played a pivotal role in driving EUR/USD and GBP/USD price action.
What’s behind the rebound in US bond yields?
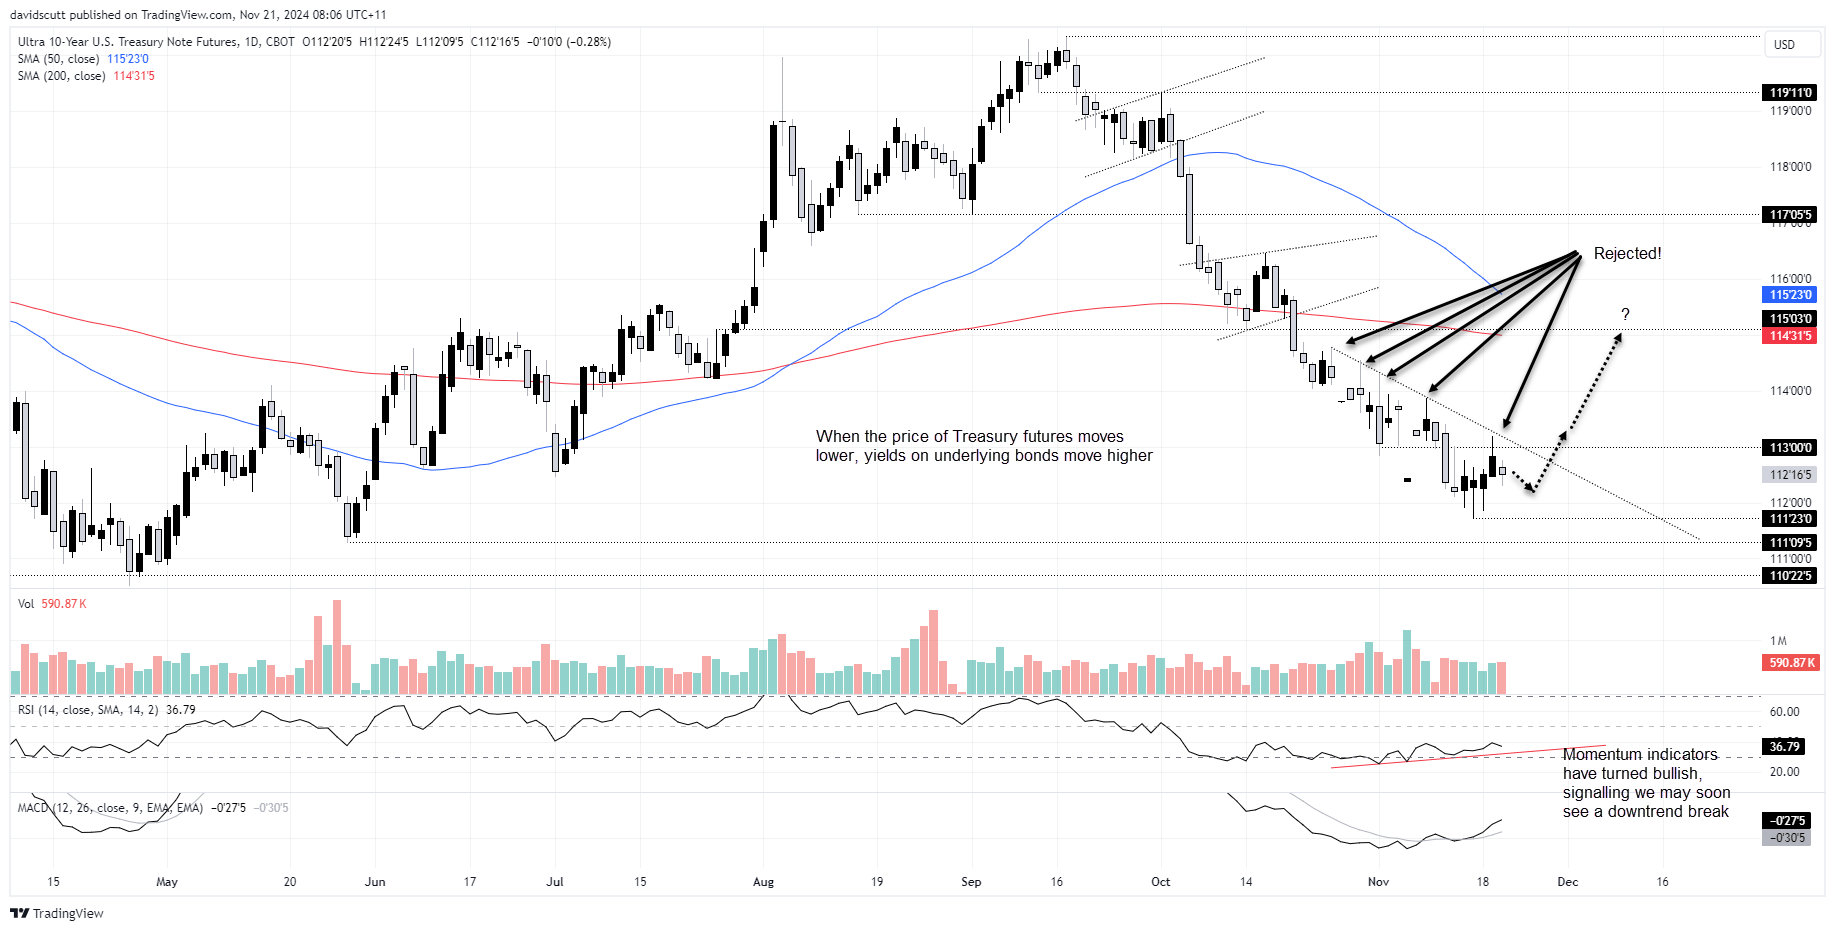
Some attributed the rise in yields to a soft 20-year US Treasury auction, but seasoned rates traders know this tenor is widely disliked due to its limited portfolio suitability, making it an unreliable indicator. Others pointed to the hot UK inflation data, echoing Canada’s report a day earlier. While notable, it’s unusual for US Treasury markets to react meaningfully to foreign data. Instead, the reversal in US 10-year Treasury note futures offers a clearer explanation.
Benchmark bond futures rejected, again!

Source: Trading View
After briefly breaching 113’00 on Tuesday, prices failed once again at known downtrend resistance, likely triggering a selloff that drove Treasury prices lower and yields higher. This marked the fifth consecutive failure at the trendline. While the sustainability of the selloff is questionable given a lack of major economic catalysts and momentum signals turning bullish, the rise in yields likely weighed on EUR/USD and GBP/USD.
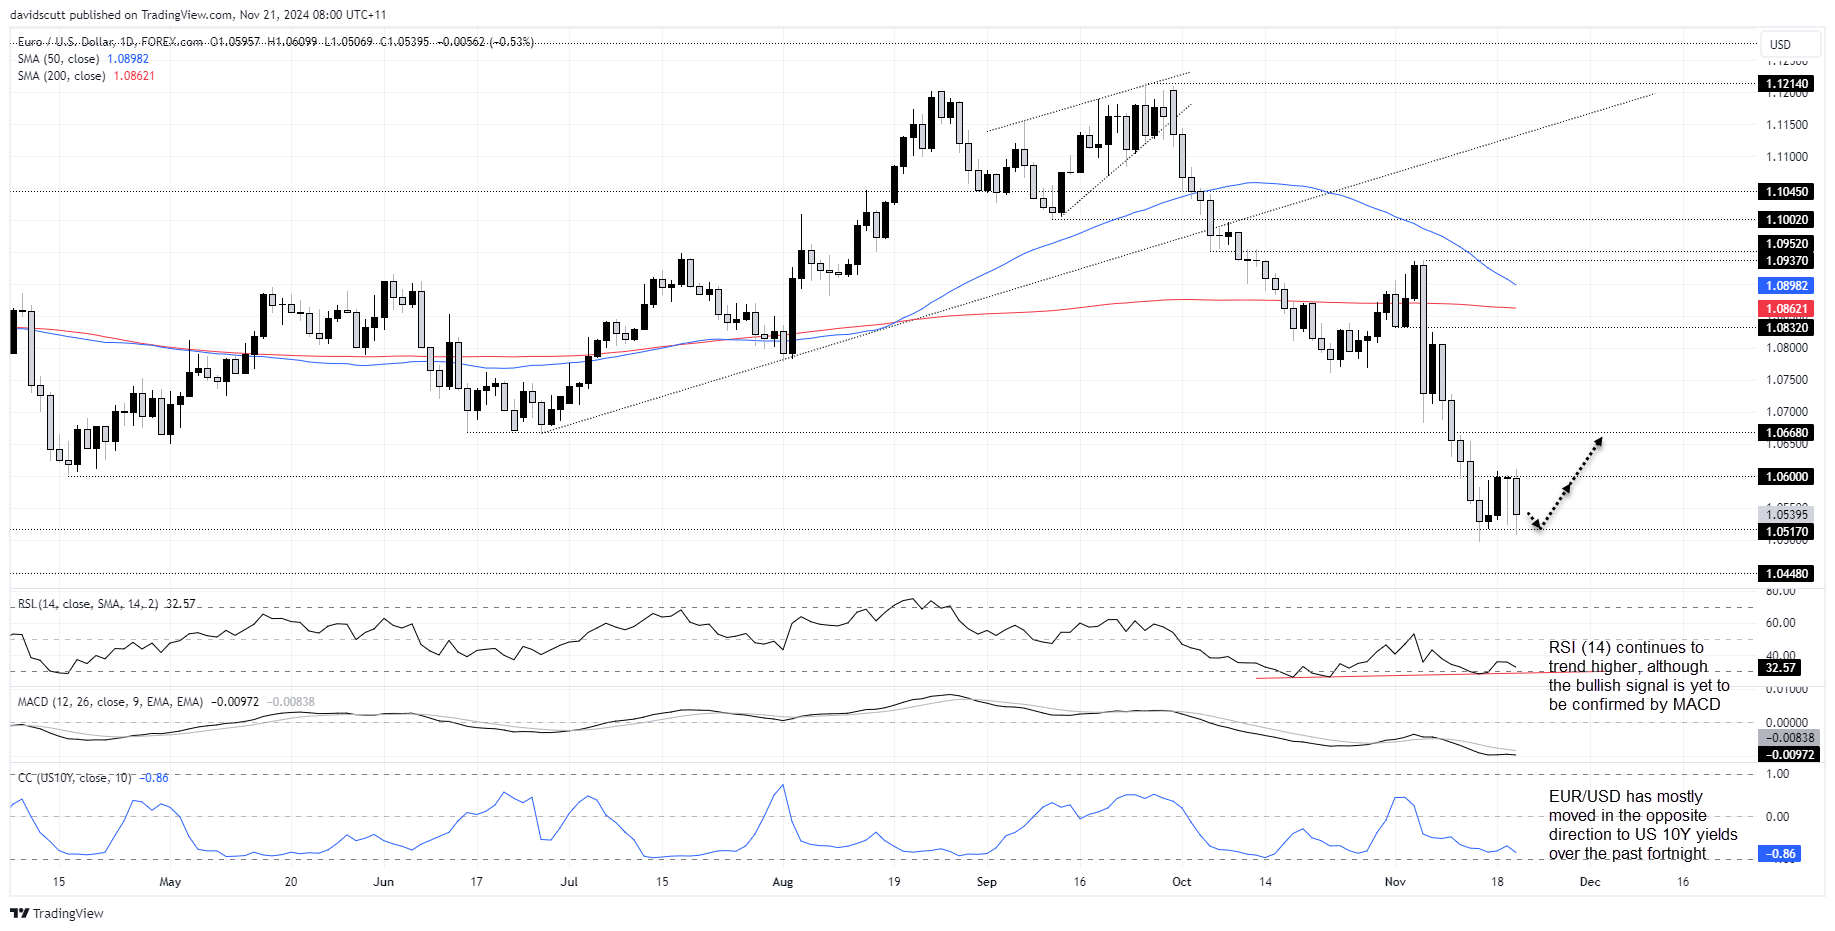
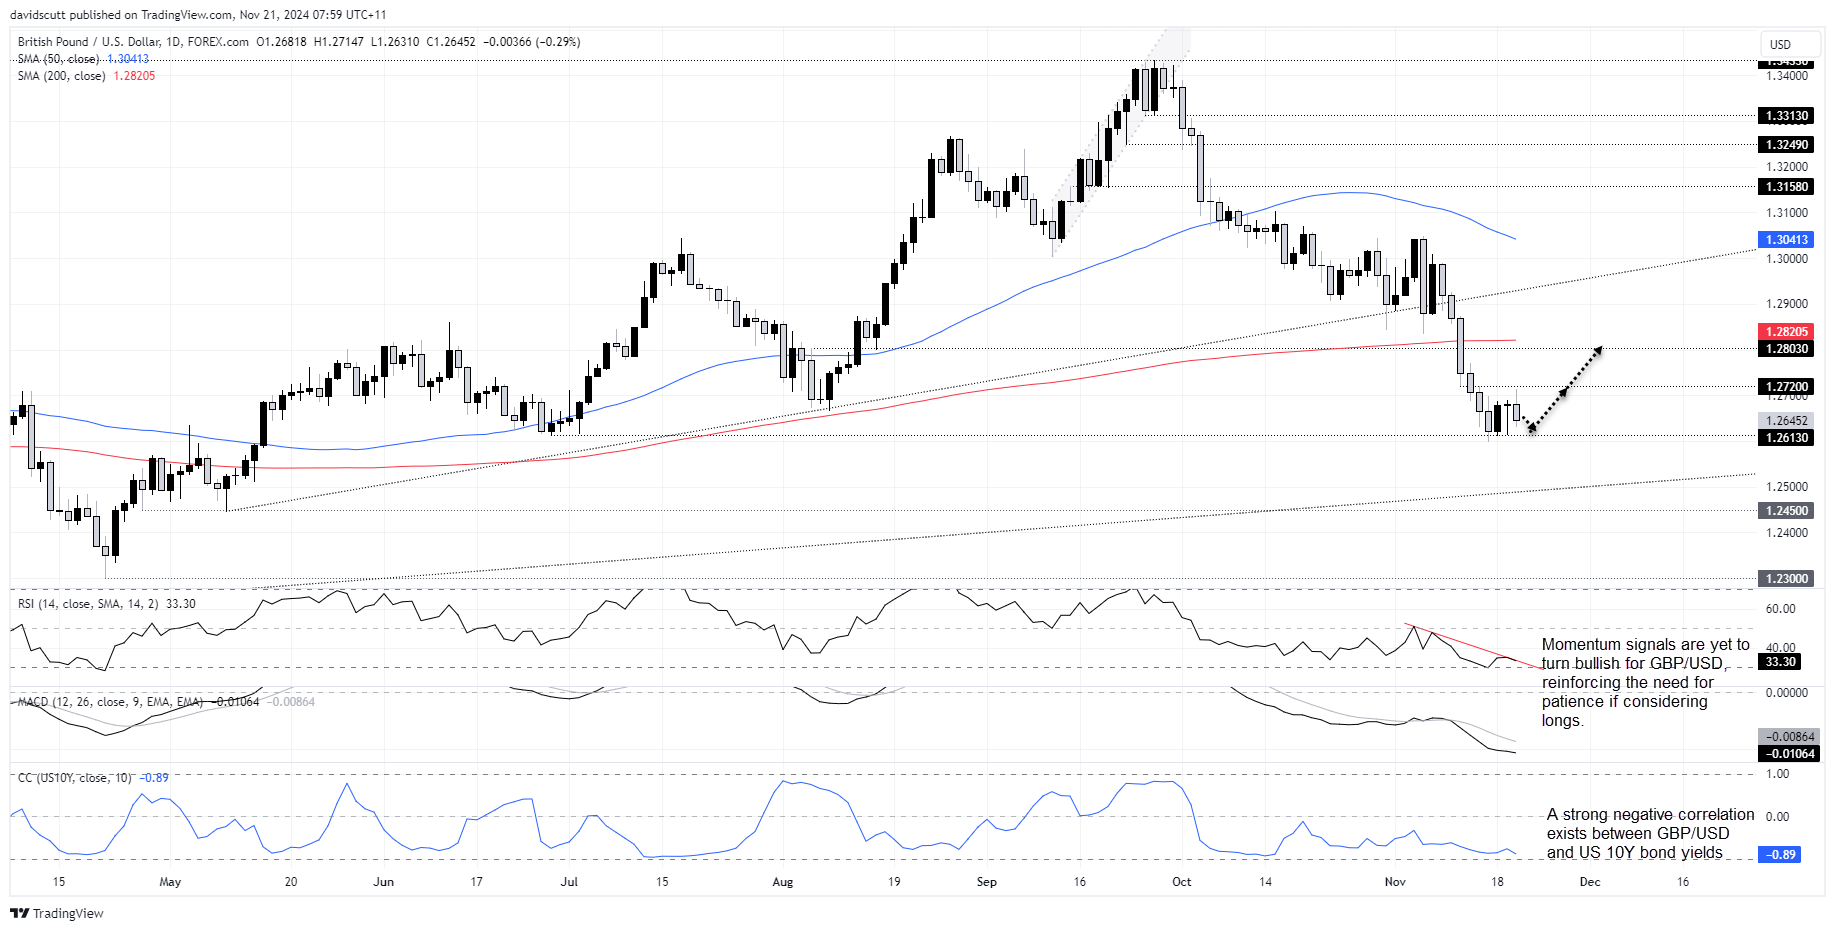
The strong negative correlation over the past fortnight between US benchmark bond yields and both pairs remains intact, as seen in the bottom pane in the charts below.
EUR/USD: buying dips still preferred

Source: Trading View
Wednesday’s yield-driven reversal saw EUR/USD retreat sharply, continuing its whipsawing between 1.0600 and 1.0517. The latest bearish evening star pattern suggests further downside risks, but this follows a bullish morning star pattern the day before, adding to the confusion. RSI divergence from price hints at potential upside, supporting a buy-the-dip approach. Longs could be considered near 1.0517 with stops below 1.0500, targeting 1.0600 initially and 1.0668 beyond that.
Hot inflation not enough to boost GBP/USD

Source: Trading View
GBP/USD also struggled, with higher US yields overwhelming the temporary boost from UK inflation data. Unlike EUR/USD, momentum indicators like RSI and MACD remain bearish, limiting upside appeal. The 1.2613 level offers a possible entry point for longs, with tight stops below and targets at 1.2720 and the 200-day moving average near 1.2803.
While upcoming UK retail sales and flash PMIs may provide temporary volatility, the lack of major US economic data until late next week suggests broader moves will continue to hinge on US yield dynamics.
-- Written by David Scutt
Follow David on Twitter @scutty


