- EUR/JPY: A break below the 50DMA could open the door to 163.57 support; 200DMA a key target for bears
- GBP/JPY: Uptrend intact, but failure to clear 199.50 raises downside risks; watch 196 and 200DMA below
- Both pairs showing fading bullish momentum, with RSI and MACD signalling potential downside
Overview
Big swings during the Presidential election decimated technical levels for many currencies against the US dollar. However, it was another story against the crosses, including the Japanese yen. Not only did some survive the burst of volatility, but many continued to be respected. With a quieter week ahead on the macro front, this note focuses on potential trade setups in EUR/JPY and GBP/JPY heading into the weekend.
US rates key to directional risks
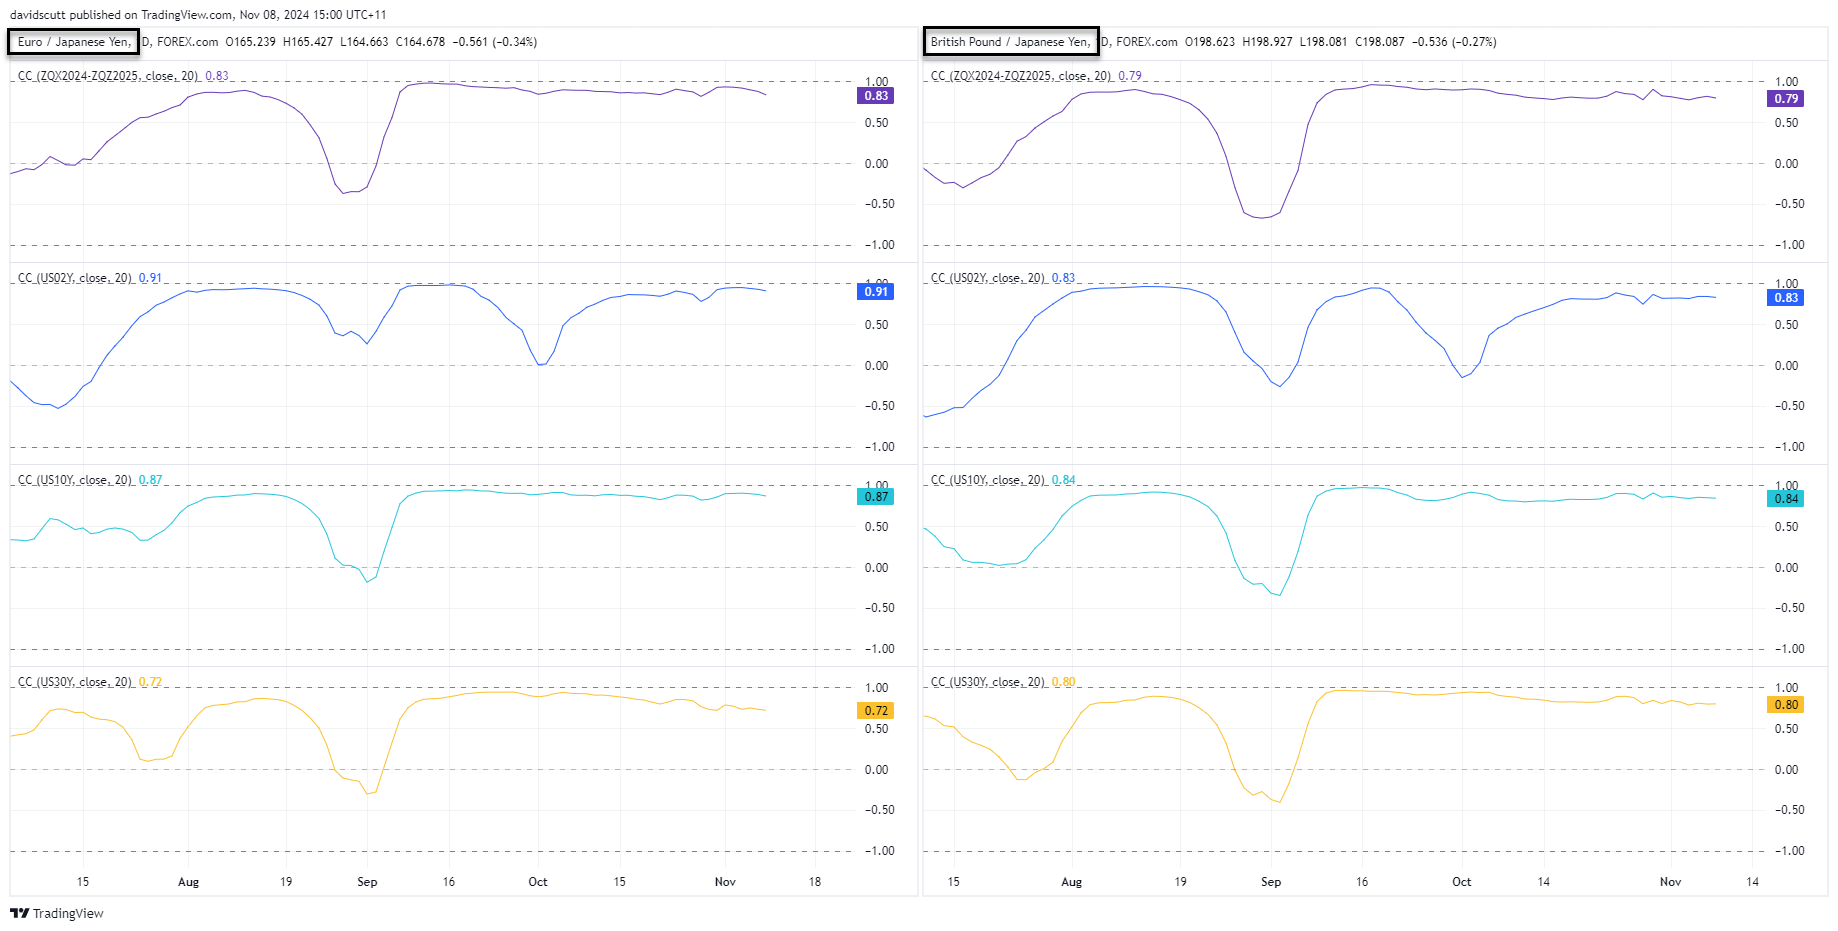
Looking at lower-beta currencies like the euro and pound, US interest rate expectations continue to drive moves in yen crosses, especially along the short end of the Treasury curve. The chart below shows the 20-day rolling correlation between EUR/JPY and GBP/JPY against various US rate metrics, from Fed cut pricing through to 30-year Treasury yields. The takeaway: US rate expectations often have a bigger impact on the yen than on European currencies against the US dollar.

Source: TradingView
EUR/JPY keeling over
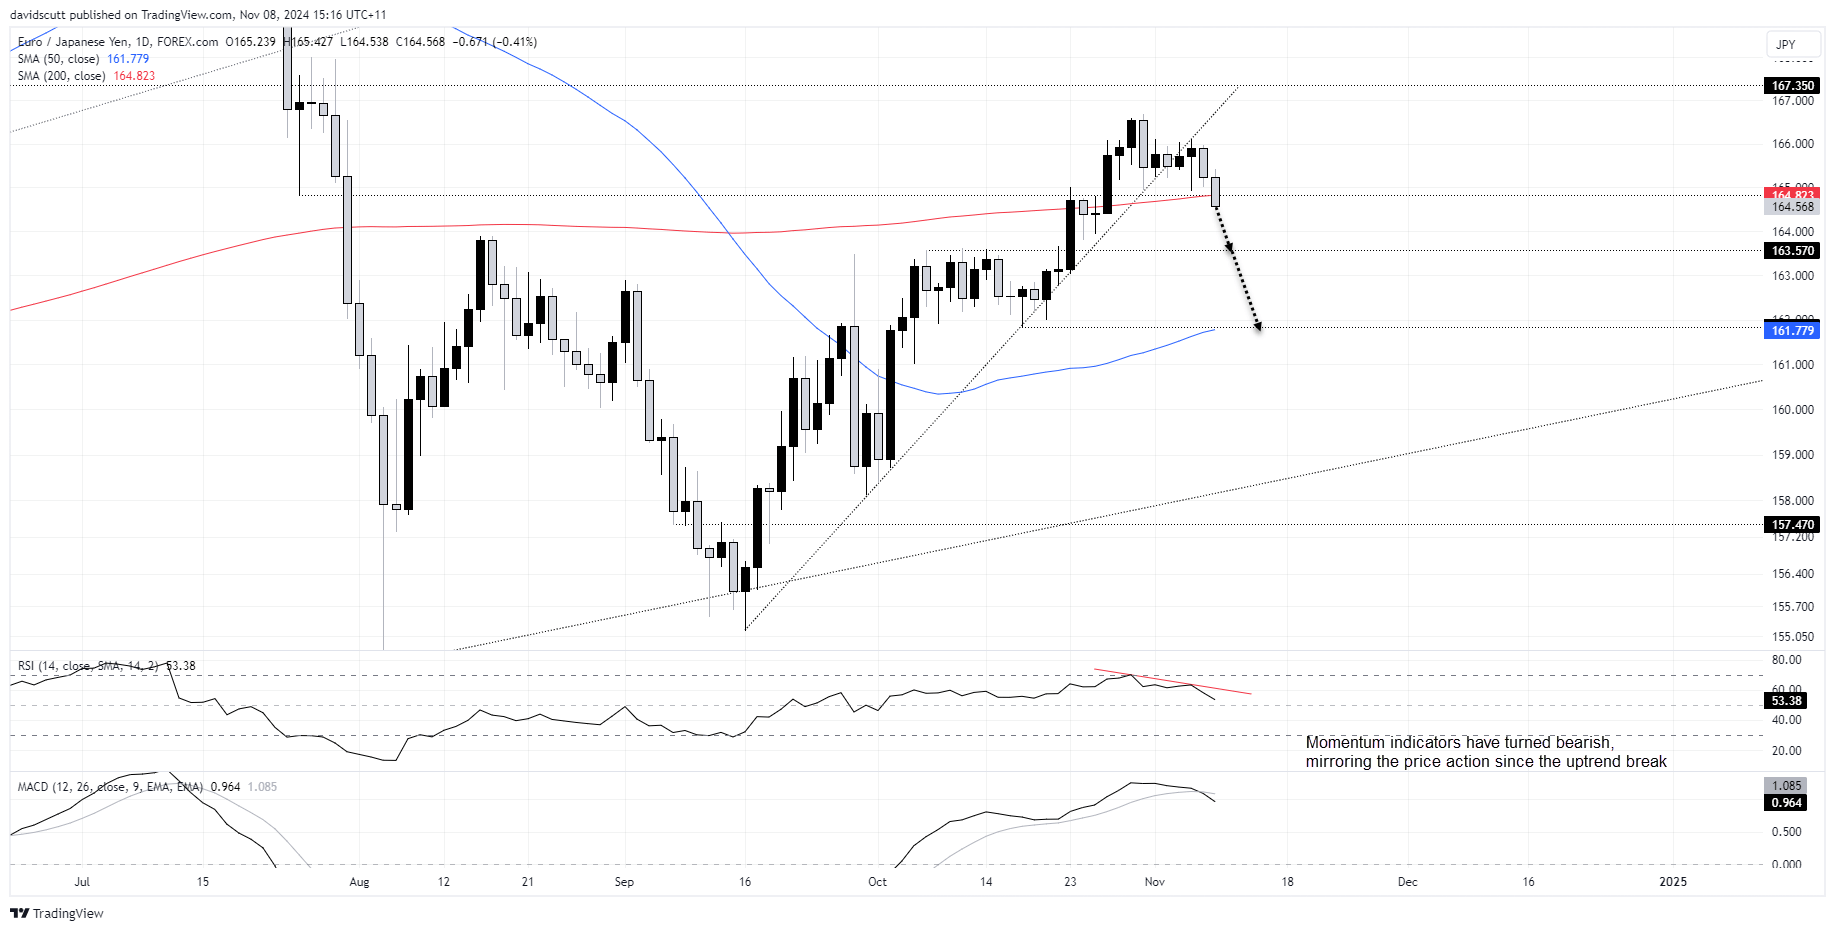
EUR/JPY looks heavy on the daily chart having broken the uptrend it was sitting in for much of the past two months. The price is threatening to fall decisively through the 50-day moving average which also coincides with minor horizontal support. RSI (14) is trending lower, indicating waning bullish momentum. MACD has also crossed over from above, confirming the bearish signal.
If the pair falls decisively through the 50DMA, traders could sell the break with a tight stop above for protection. Buying may be encountered around 163.57 where the price struggled to break through in the first half of October. If that were to give way, the 200-day moving average looms as a tougher test for bears.

Source: TradingView
GBP/JPY lacking bullish momentum
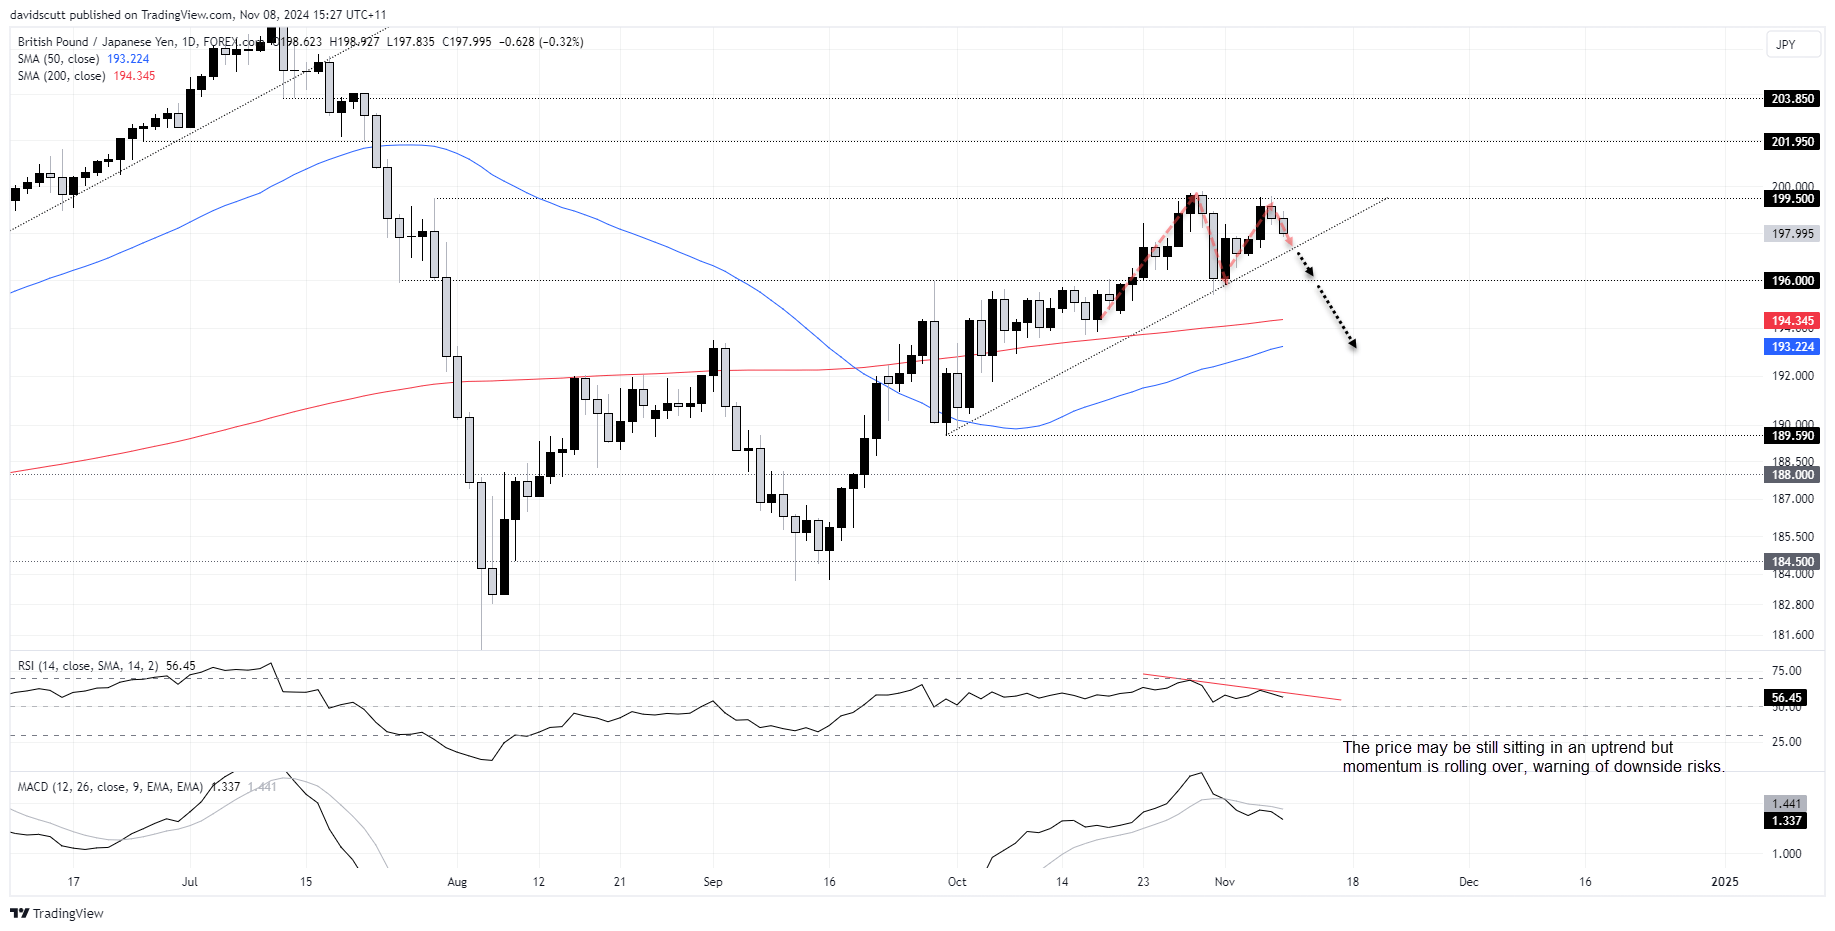
The technical picture looks less dire for GBP/JPY in the near-term with the price remaining in an uptrend first established in late September.
However, having been unable to clear resistance overhead at 199.50 over recent weeks, downside risks may be building. It’s yet to be completed, but the three-candle pattern resembles an evening star formation. RSI (14) is trending lower while MACD has rolled over, providing bearish signals on price momentum.
If the price were to break the uptrend, 196 is a level that has provided both support and resistance at points this year. Below, the 200 and 50-day moving averages are other potential targets, as is 189.59 and 188.00.
Alternatively, if we were to see the price break convincingly above 199.50, 201.95 and 203.85 are two levels of note.

Source: TradingView
-- Written by David Scutt
Follow David on Twitter @scutty


