Equities technical outlook: S&P 500, Nasdaq & Dow daily trade levels
- S&P 500 support 3844, 3812, 3760 (key) – resistance 3928/36, 3987-4002 (key)
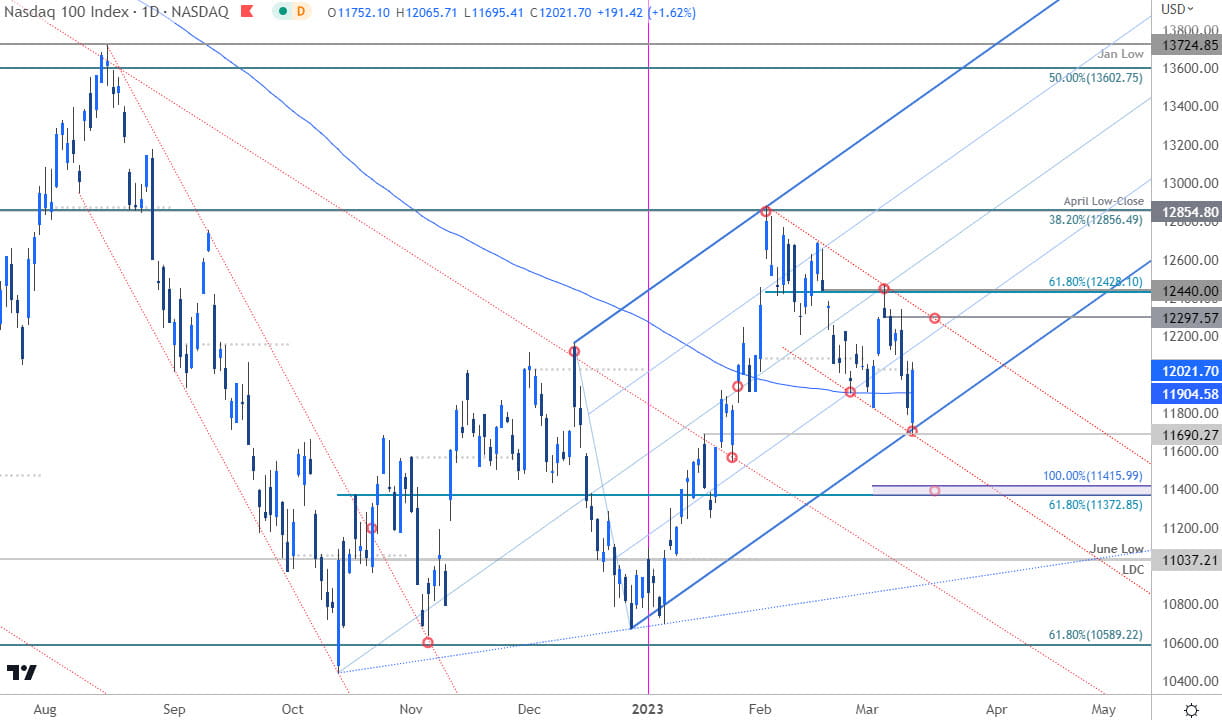
- NASDAQ support 11690, 11372/415 (key), 11037 – resistance 12026, 12297, 12428 (key)
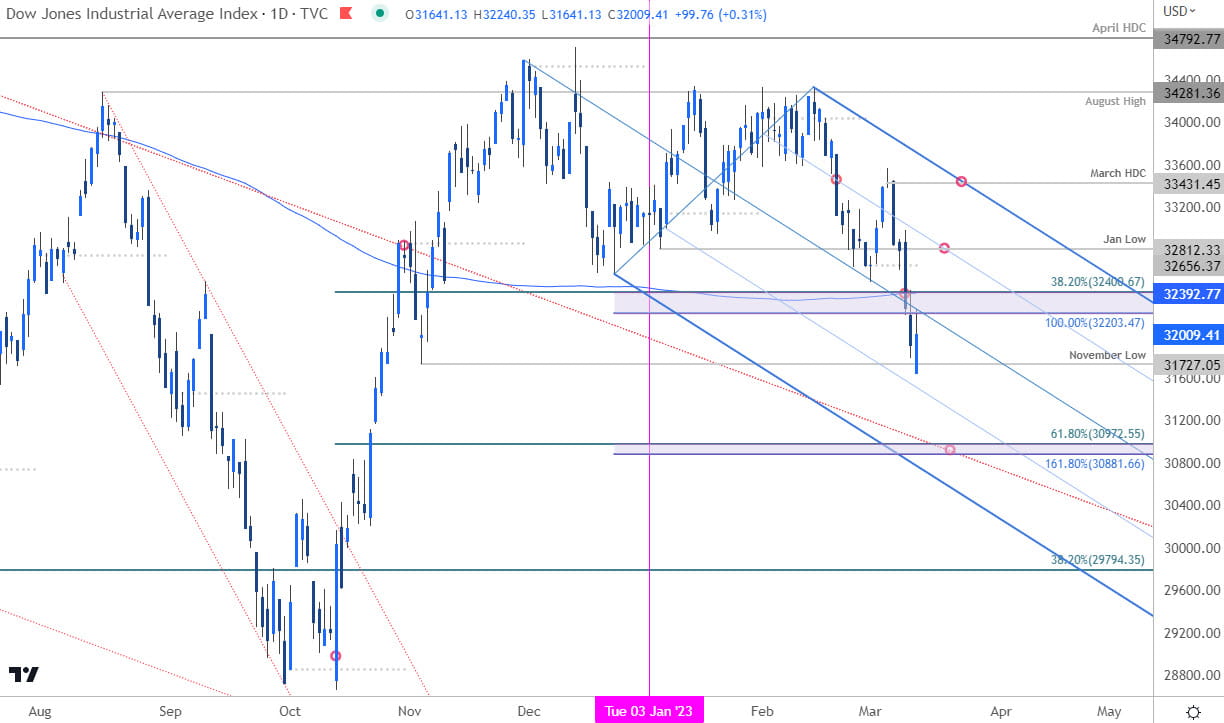
- Dow support 31727, ~31480, 30881/972 (key) – resistance 32400, 32812, 33431 (key)
The events over the past few days have roiled global markets with the S&P 500, the NASDAQ and the Dow plunging more than 7% off the yearly highs. The battle lines are drawn heading into the second half to the month - these are the updated targets and invalidation levels that matter on the SPX500, NDX and DJI daily technical charts.
Discuss these technical setups and more in the Weekly Strategy Webinars on Monday’s at 8:30am EST.
S&P 500 Price Chart – SPX Daily

Chart Prepared by Michael Boutros, Sr. Technical Strategist; SPX500 on TradingView
Notes: In my last S&P 500 short-term price outlook we noted that the SPX500 was, “testing a critical support zone today at 3906/28- a region defined by the May low-day close and the 61.8% Fibonacci retracement of the December advance.” The index rallied more than 4% in the following days before reversing sharply off the early-December reversal close / downtrend resistance at 4073. Since then, the index has plunged more than 6.6% in the subsequent days with a break below key support rebounding today off the yearly low-close at 3812.
The immediate focus on a breakout of today’s range for guidance. Initial resistance now stands with the 61.8% Fibonacci retracement of the December advance / 200-day moving average at 3928/36. Broader bearish invalidation is eyed at the March 7th reversal close / 50% retracement at 3987-4002 – a breach / daily close above this threshold would be needed to suggest a more significant low is in place.
Initial support rest with the objective yearly open at 3844 backed by the December lows/ 61.8% retracement of the October advance at 3760/63 – an area of interest for possible downside exhaustion / price inflection IF reached. Caution, losses below this threshold would threaten another accelerated decline towards the 2021 low / 2022 low-day close at 3664/69.
Nasdaq Price Chart – NDX Daily

Chart Prepared by Michael Boutros, Sr. Technical Strategist; Nasdaq on TradingView
Notes: Nasdaq rebounded off confluent support today around the January 18th high near 11690 (low registered today at 11695). The index is poised to mark an outside-day reversal off slope support and takes price back above the 200-day moving average.
Initial resistance is being tested today at the objective March open around 12026 and is backed by the monthly high-day close at 12297- both an area of interest for possible topside exhaustion / price inflection IF reached. Ultimately a breach / close above the 61.8% retracement at 12428 would be needed to mark resumption of the broader uptrend.
A break below this support zone would threaten another accelerated decline towards critical support at 11372/415- a region defined by the 100% extension of the yearly decline / 61.8% retracement of the October rally. Look for a larger reaction there IF reached.
Dow Jones Price Chart – DJI Daily

Chart Prepared by Michael Boutros, Sr. Technical Strategist; Dow Jones on TradingView
Notes: The Dow Jones Industrial Average slammed though a key support barrier last week at 32203/400 – a region define by the 100% extension of the December decline, the 200-day moving average and the 38.2% retracement of the October rally. This region has already been tested as resistance today and the threat remains weighted do the downside while below. Note that neither the S&P 500 nor the Nasdaq has broken below the yearly opening-range and this non-confirmation low has us questioning the legitimacy of the breakdown. That said, we’ll be watching this closely in the days ahead.
A break below the November lows at 31727 would be needed to mark resumption towards the 25% parallel (currently 31480s) with key support eye at 30881/972- a region defined by the 1.618% extension and the 61.8% retracement. Look for a larger reaction there IF reached.
A pivot back above 32400 would alleviate further downside pressure in the short-term with subsequent resistance eyed at 32656 (March open) and the January lows at 32812. Broader bearish invalidation now lowered to the monthly high-day close at 33431.
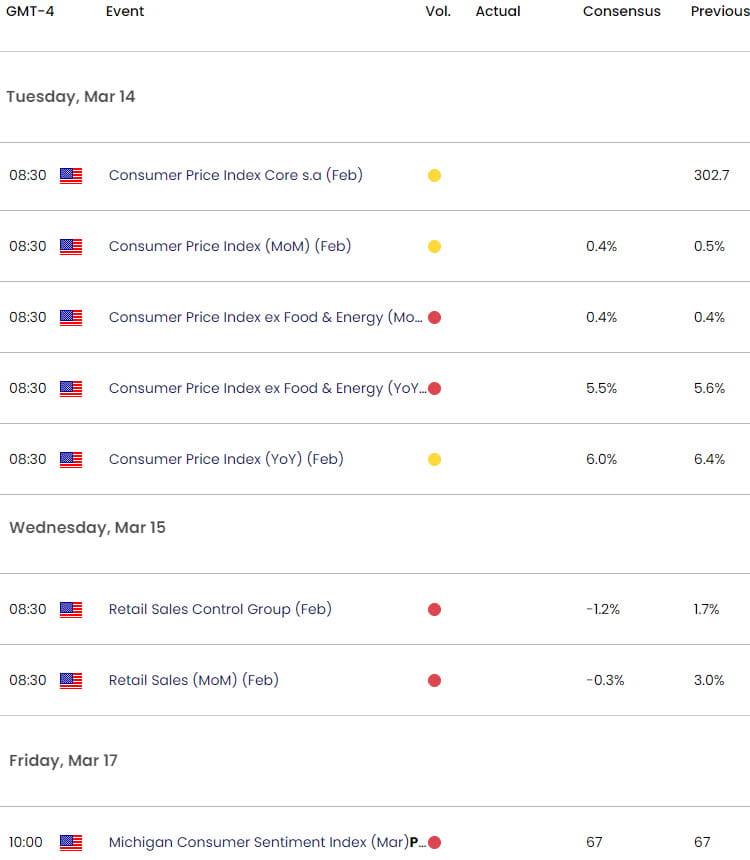
Key Economic Data Releases

Economic Calendar - latest economic developments and upcoming event risk.
Active Short-term Technical Charts
- Gold short-term price outlook: XAU/USD reversal gathers pace
- Canadian Dollar short-term outlook: USD/CAD breakout levels
- Euro short-term technical outlook: EUR/USD breakdown underway
- US Dollar short-term price outlook: DXY looks for a low
- Japanese Yen short-term price outlook: USD/JPY Rally Fizzles
--- Written by Michael Boutros, Sr Technical Strategist with FOREX.com
Follow Michael on Twitter @MBForex


